- Summary:
- The Loopring price has surged over 400% in November and shows no signs of slowing down, and may even have more room to run.
The Loopring price has surged over 400% in November and shows no signs of slowing down, and may even have more room to run. In early trading on Wednesday, Loopring (LRC) is consolidating below its $3.038 lifetime best. LRC is currently trading at $2.928 (+2.88%), lifting its year-to-date performance to +1,650%.
Incredibly, most of LRC’s 2021 gains have come in the last few weeks after a report revealed that GameStop (NYSE: GME) is working with Loopring on an NFT project. As a result, Loopring’s market cap has exploded to $3.8 billion, ranking it the 52nd most valuable cryptocurrency ahead of Neo (NEO).
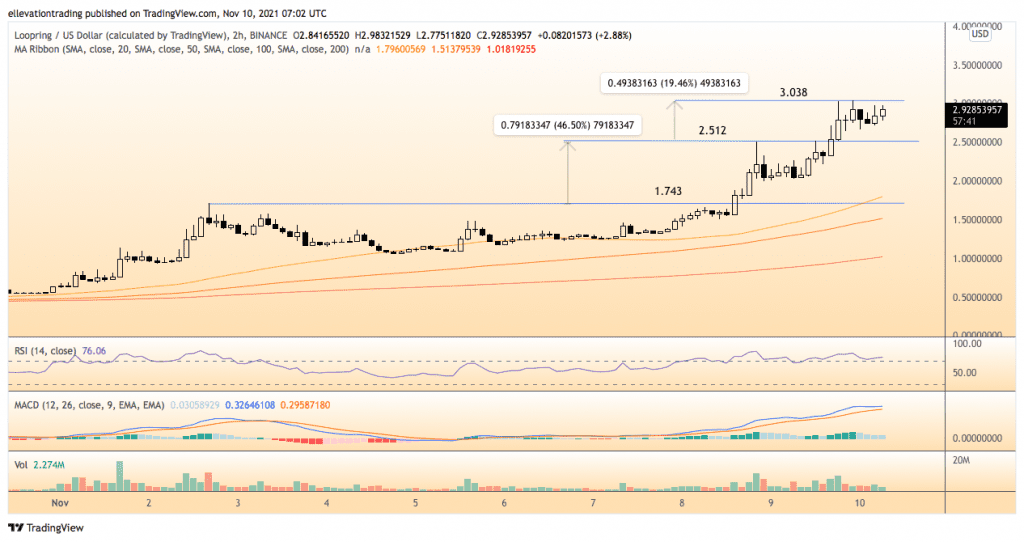
But the biggest question is whether LRC will keep ripping higher in the immediate future or leave late-to-the-party investors holding the bag? Whilst it’s hard to say if the euphoric buying spree will continue, the 2-hour price chart highlights what could happen if it does.
LRC Price Analysis
The 2-hour chart shows the Loopring price is testing the horizontal resistance of the former ATH at $3.038. Notably, earlier breakouts in November have resulted in impulse moves higher.
After clearing $1.743 on the 8th, LRC extended a further 46.5% before settling. A similar event happened on the 9th when Loopring jumped 19.50% once it passed $2.512. On that basis, if LRC clears $3.038, we could expect an upside acceleration to $3.640 (19.5%) and potentially $4.460 (46.50%).
However, the Relative Strength Index (RSI) reads 74 on the 2-hour chart and a worrying 90.0 on the daily chart. Therefore, even if the Loopring price achieves our most optimistic prediction, it’s likely to be short-lived. Furthermore, a failure to break through on the upside could drive LRC down to support at $2.512.
Considering the recent price action, I expect LRC to explode towards my $3.640 price target and potentially higher. However, a close below $2.510 derails the momentum and invalidates my bullish view.
Loopring Price Chart (2-hour)

For more market insights, follow Elliott on Twitter.


