- Summary:
- The Gold price has closed higher in each of the last four days, reaching a pivotal level, which, if cleared, could trigger a run to $2,000.
The Gold price has closed higher in each of the last four days, reaching a pivotal level, which, if cleared, could trigger a run to $2,000. Below we examine the essential levels that all traders should keep an eye on.
Spot Gold has seen a return to form following last weeks FOMC meeting. XAUSD has gained 4% over the previous week, closing at a two-month high of $1,831.90 on Tuesday. Several recent developments are providing headwinds for the yellow metal. The Fed’s insistence that interest rates will be remaining low for some time, despite rising inflation, is undoubtedly the most significant catalyst. Also, Gold is seeing a safe-haven bid due to China’s growing debt crisis.
XAU/USD Price Analysis
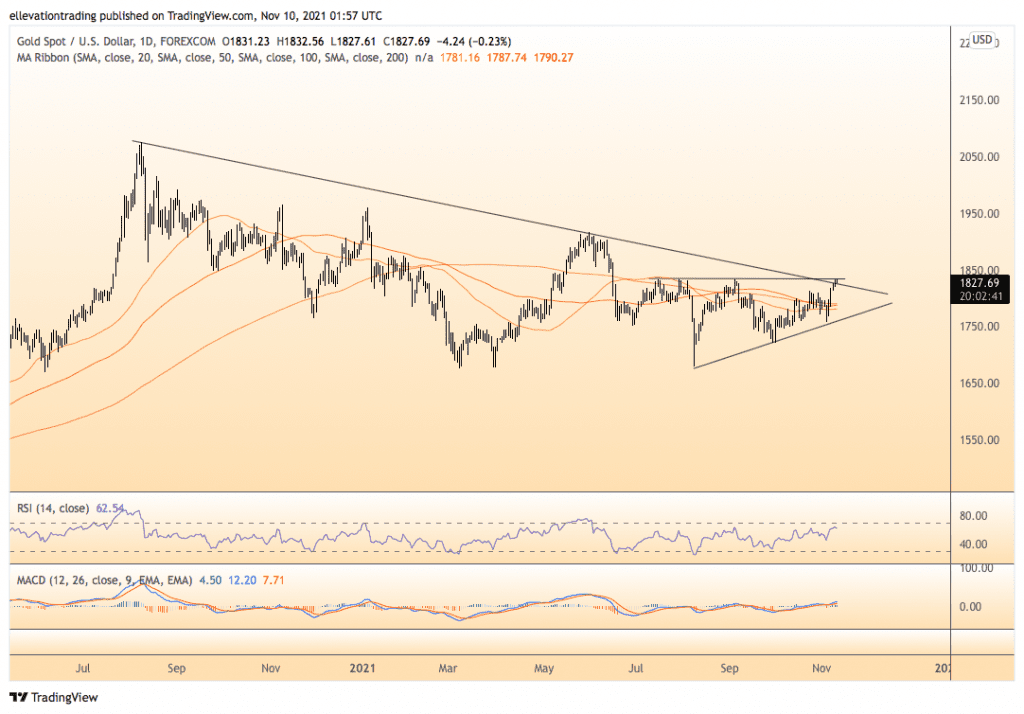
The daily chart shows the Gold Price is breaking out of a long term down-trend at $1,826. However, the robust horizontal resistance at $1,834 is the biggest obstacle. Successful clearance of $1,834 should drive the price towards the June high of $1,916. At the same time, an exaggerated extension could target the November 2020 high at $1,965.50 and potentially $2,000.
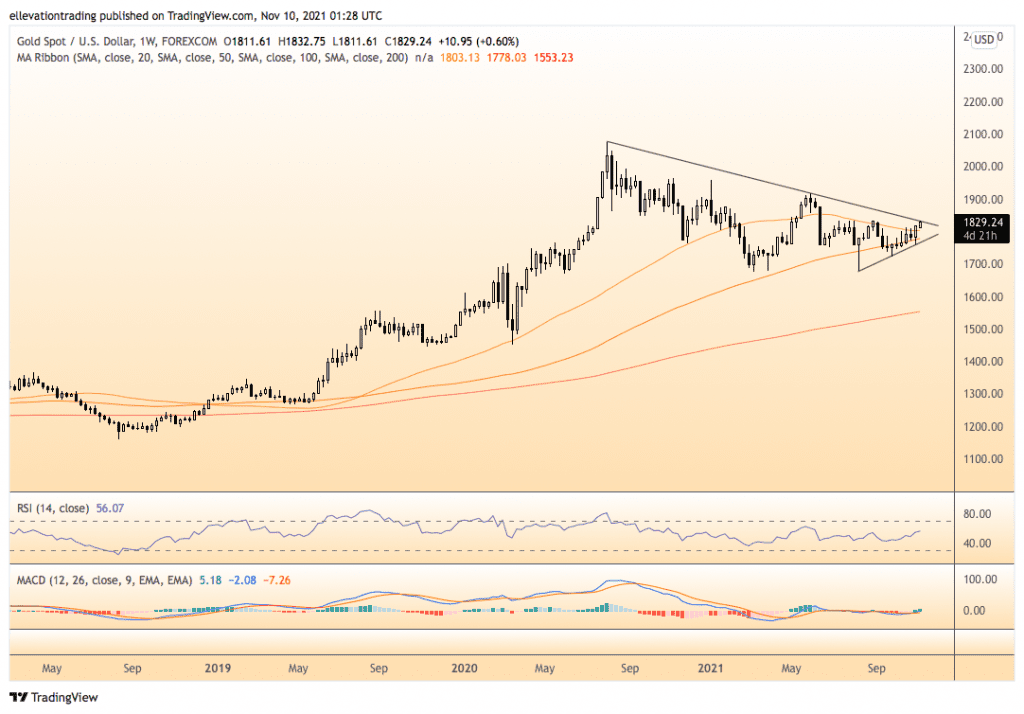
Turning to the weekly chart, we see the price is also breaking out on the longer time frame. I consider this particularly constructive, as it will encourage longer-term macro players into the mix. On that basis, a weekly close above $1,834 triggers my $1,965 -$2,000 price target.
However, if the Gold price closes below $1,834 on Friday, it will invalidate the bullish breakout thesis. In that event, traders should wait for a confirmed close above the trend at the end of next week.
Gold Price Chart (daily)

Weekly Chart

For more market insights, follow Elliott on Twitter.


