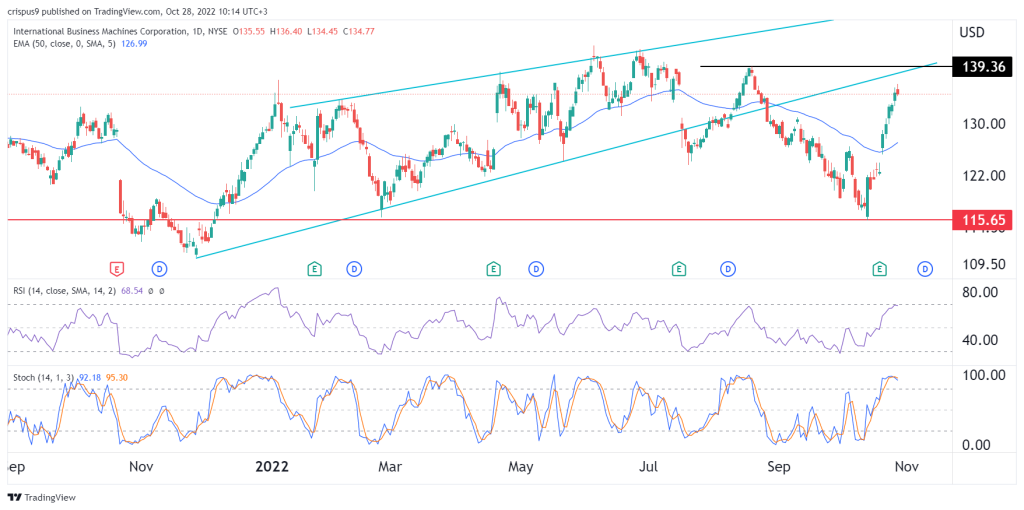
- IBM share price has made a strong bullish trend in the past few days as investors focus on its earnings. The shares rose to a high of $136.30
IBM share price has made a strong bullish trend in the past few days as investors focus on its earnings. The shares rose to a high of $136.30, which was about 17% above the lowest level this month. This price is the highest it has been since 22nd August of this year, giving it a market cap of over $120 billion.
IBM business is doing well
The IBM stock price has done well in the past few days after the company’s positive earnings. In Q3, the company had over $14.1 billion while its pre-tax income rose to over $2 billion. Its software revenue rose by 14% while its consulting revenue jumped by 16%. Infrastructure rose by 23%. Red Hat revenue surged by 18% while automation rose by 3%.
Other IBM’s businesses also did relatively well in the quarter even as companies slashed their cost of doing business. Transaction processing revenue jumped by 33% while its security business grew by 6% while business transformation revenue rose by 14%.
IBM business is doing well. It has a higher dividend yield of 4.87% and a forward PE of 4.89%. It has a payout ratio of 74.30%, which is relatively safe. The company has had 22 years of dividend growth, meaning that it is just 3 years shy of becoming a dividend aristocrat. Its four-year average yield is about 4.95%.
IBM’s business is gaining market share in cloud computing. Its EBITDA margin of 28% is higher than that of its key competitors like Wipro, Infosys, and Accenture.
IBM share price forecast
The daily chart shows that the IBM stock price formed a rising wedge pattern that is shown in green. In price action analysis, a rising wedge is usually a bearish sign. This view was confirmed when the stock crashed to a low of $115, which was the lowest level in December 2021.
The stock has rebounded recently and is approaching the lower side of the wedge pattern. Oscillators like the Stochastic Oscillator and the Relative Strength Index (RSI) have continued rising.
Therefore, the IBM share price will likely continue rising as bulls target the key resistance level at $140, which was the highest point on August 19th. A drop below the key support level at $135 will invalidate the bullish view.


