- Summary:
- The HSBC Share price continues to bleed value in September, losing 3.7% since the start of the month, and is now underwater for 2021.
The HSBC share price continues to bleed value in September, losing 3.7% since the start of the month and is now underwater for 2021. Despite the poor performance this year, given the current backdrop, the share price may still not offer an attractive opportunity. The bank’s exposure to the once-lucrative Asian market could prove a problem for shareholders in the near term.
Europe’s second-largest Banking group HSBC Holdings Plc (LON: HSBA), formerly HongKong Shanghai Banking Corporation, has its roots steeped in Asia. And despite being a true multi-national, the bank still derives much of its revenue from the region. Furthermore, HSBC recently increased its exposure to the region’s ultra-wealthy by expanding its Asia-focused wealth management division. However, the ill-timed move came just before the Chinese Communist Party (CCP) announced measures to narrow the country’s wealth gap. It goes without saying that if the state plans to take a bigger bite out of the income of its wealthiest citizens, this could leave less on the table for the bank. As a result, the HSBC share price decline has accelerated in the last few weeks. Furthermore, the technical indicators are breaking down.
Technical Analysis
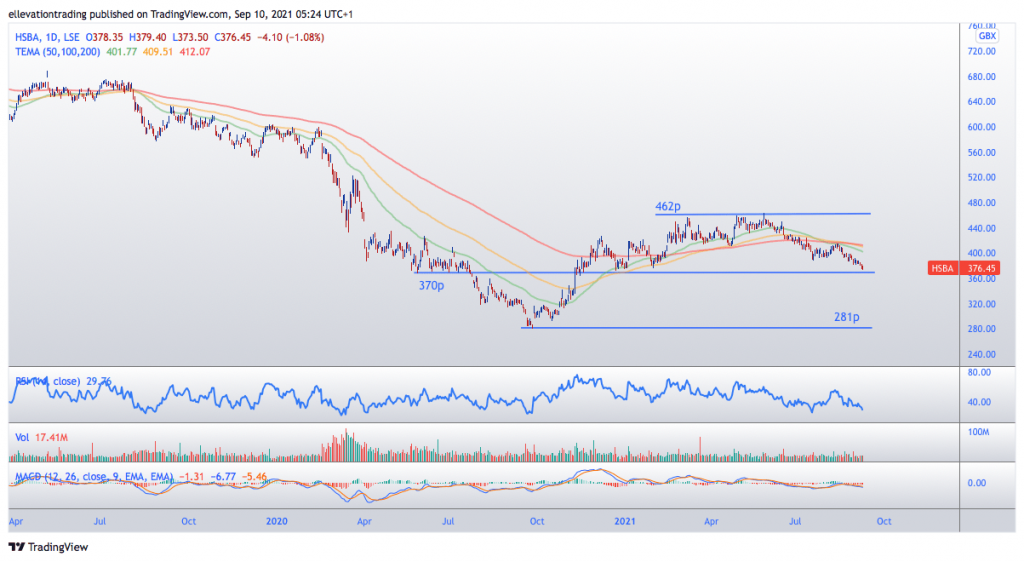
The daily chart shows the share price is approaching significant horizontal support at 370p. This should be considered a make or break price for HSBC. Should the share price lose this support level, an extension towards the 2020 low of 281p looks probable.
The Relative Strength Index (RSI) and the Moving Average Convergence Divergence Indicator (MACD) are trending lower, lending weight to the negative outlook. Not to mention, the 50-day moving average at 401.77p has crossed below the longer-term 200-day average at 412.07p, which highlights growing bearish momentum.
In my view, the HSBC share price will continue to trade with a bearish bias until such a time it recovers the 200-day moving average. However, it’s hard to see a bullish catalyst capable of lifting the price by the required 10%.
HSBC Share Price Chart (Daily)

For more market insights, follow Elliott on Twitter.


