- Summary:
- In this article, we discuss how to apply Fibonacci retracement levels and the meaning behind this trading tool.
Fibonacci retracements are one of the most popular tools employed by financial market traders to predict possible price movements in the future. The tool was developed from Fibonacci numbers sequence, which follows a certain sequence from zero and build up in a certain way each number is the sum of the two numbers before it. The Fibonacci sequence is as follows: 0, 1, 1, 2, 3, 5, 8, 13, 21, 34, 55, 89, and this sequence goes on and one to infinity. There is a constant ratio of about 1.618 when you divide each number in the series by the one before it. For example, 55/34= 1.618, 89/55=1.618.
The ratio 1.618 is commonly referred to as the Golden Ratio or Phi. The Fibonacci sequence was not developed out of the blues, but is based on natural phenomena. The ratio is expressed in things like the human hand, sunflower seeds, the ratio of male to female bees in a beehive, rock formation, vegetables etc. The Fibonacci numbers were discovered by an Italian mathematician, Leonardo Pisano Bogollo, nicknamed Fibonacci. While his discovery has extensive applications, traders also adopted it.
What do Fibonacci Retracement Levels tell us?
The Fibonacci retracement levels displayed on an asset’s trading chart are useful indicators of the most probable future levels of support and resistance, and they are determined by the asset’s price history. The three crucial percentages on these lines are 23.6%, 38.2%, and 61.8%, and they are all derivatives of the golden ratio, 1.618. However, some traders have extended these percentages to include the 50% and 78.6% retracement levels.
Applying Fibonacci retracement in trading
Fibonacci retracement levels can be used to set alerts at potential levels of trend reversals, resistance levels, and support levels, because they typically follow previous moves. It is based on the belief that a rebound will reverse some of the previous fall, and a correction will reverse some of the previous gains. Therefore, the best time to use this tool is to wait until when a trend is underway and then start keeping an eye on particular Fibonacci retracement levels. That said, a trader has to be alert for a possible reversal when the trend approaches these levels.
If an uptrend crosses a certain Fibonacci level, that level becomes the new support, and the one after it becomes the new resistance level. Conversely, when an asset’s price drops below a significant Fibonacci retracement level, that level crossed becomes support, and the level below it becomes resistance. In all this, however, one should note that there are times when markets will ignore Fibonacci levels. Therefore, this tool should not be used in isolation. The best way is to incorporate other technical analysis tools and stay alert to changes in market fundamentals.
Fibonacci retracement in an uptrend
When trading with Fibonacci retracement levels in an uptrend, one needs to identify a trend’s swing highs. Once you’ve located the high, you then need to drag the tool all the way down to the trend’s swing low.
On the chart above, we dragged the Fibonacci retracement tool from the Swing Low at 1.5153 to the Swing High at 1.1066. Looking at the chart, we can see that the Fibonacci retracement level for the upswing was met around 1.0726 (61.8%).
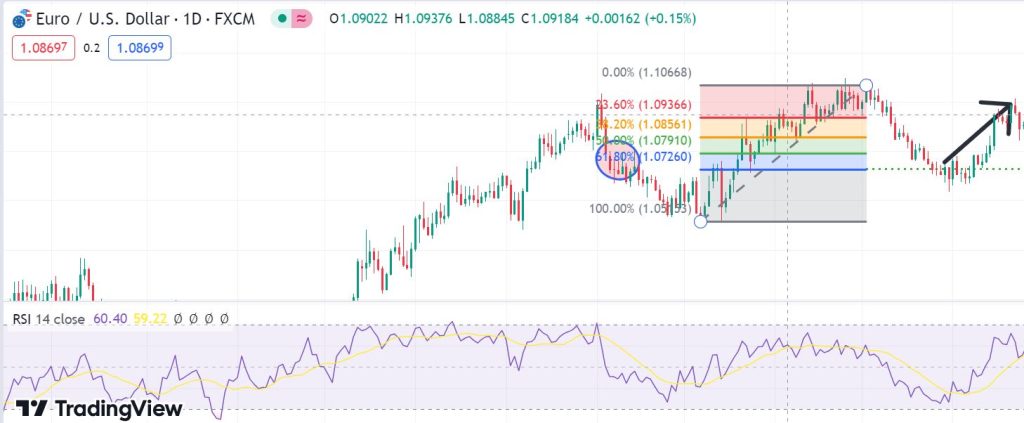
Now, if the EUR/USD price is going to retrace from its recent high, traders are likely to place buy orders near certain Fibonacci retracement levels, so that’s where they’ll look for support.
Fibonacci retracement in a Downtrend
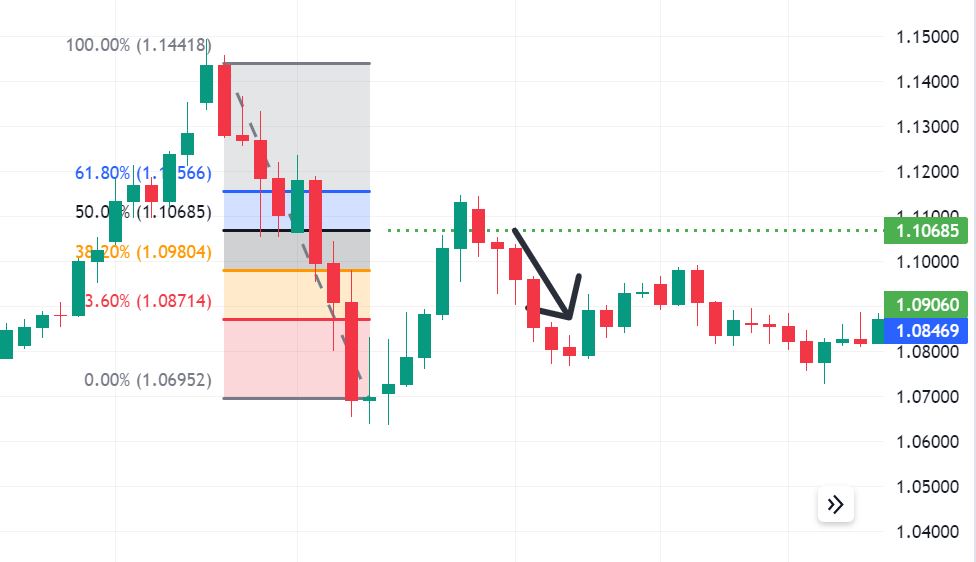
In the downtrend, we dragged the pointer from the Swing High at 1.1441 to the Swing Low at 1.0695, we were able to plot the Fibonacci retracement levels on the chart above. The downtrend previously paused at the 61.8% and resumed at the 50.0%. Therefore, for the subsequent downtrend, the trader waited for the market to hit the 50.0% level at 1.1068 to enter the market. As you can see, the downtrend continued steadily from there, going all the way down to 5 consecutive sessions.