- Summary:
- Gold price is a downward trend today ahead of the ADP employment data and the official jobless claims data. The stronger dollar has also contributed
Gold price (XAUUSD) is under pressure today ahead of the ADP employment numbers. The yellow metal is down by 0.30%, a day after it moved close to $2,000. It is trading at $1,966, which is slightly higher than the day’s low of $1,955.
Gold price is falling as some investors start to place a bet on a V-shaped recovery of the American economy after the recent positive data from the United States. For example, data released by Markit and ISM showed that manufacturing PMI rose to 53.1 and 56.0 in August. That makes August the second straight month that the manufacturing sector has been expanding.
And today, data by the Federal Reserve showed that mortgage applications declined by 2% in the previous week. While bad, that decline was better than the prior week’s decline of 6.0%. Other recent numbers from the US such as retail sales and industrial production have been positive.
Gold price is also falling ahead of the August employment numbers. Analysts expect data from ADP to show that private companies employed more than 950k jobs in August. That will be a bigger number than the previous month’s 167k. And on Friday this week, analysts expect data to show that the economy added almost a million jobs during the month.
Meanwhile, the US dollar is in the green today. The currency has gained by 0.50% against the euro, 0.23% against the British pound, and by 0.30% against the Japanese yen. A stronger US dollar is usually a positive thing for gold prices because the metal is usually priced in the currency.
Gold price technical forecast
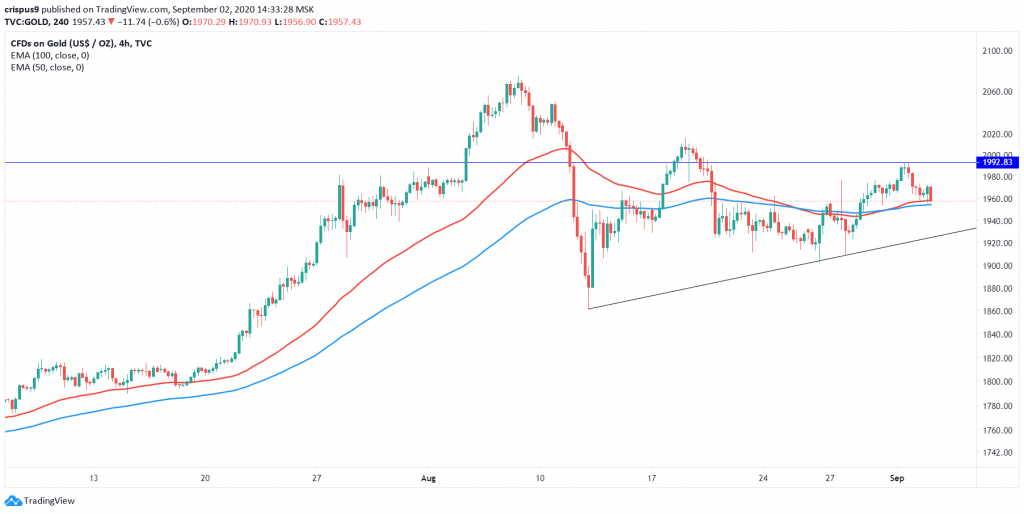
The four-hour chart shows that gold price has been moving in a sideways direction. It is trading at $1,966, which is lower than yesterday’s high of $1,992. Most importantly, the price is along the 50-day and 100-day exponential moving averages. It is also above the black ascending trend line, which connects the lowest level on August 12, 26, and 27.
I suspect that gold price will continue falling if it moves below these moving averages. If it happens, it will continue moving lower as bears target the next support at $1,900. On the flip side, a move above yesterday’s high of $1,992 will invalidate this trend.
Gold Price 4-Hour Chart


