Bitcoin - BTCUSD
Bitcoin price (BTCUSD) is in its consolidation phase a few days after it dropped from above $11,942 to below $10,000. The currency is trading at $10,422, which is the same range it was last week. Other digital currencies are also slightly lower, with Ethereum and Ripple price falling by more than 1%.
Bitcoin price is little changed today even after reports emerged that Bitcoin miners were selling their coins at a faster rate. That has helped push the price lower in the past few days. According to On-Chain, more miners have been selling large blocks of the currency recently. Similarly, another report by Glassnode said that the inflow of miners to exchanges had risen to the highest level in five months.
This dumping of BTC by miners is possibly because of profit taking after the price rose to a high of $12,492. It is also possibly because miners are concerned about the future price of the digital currency.
Meanwhile, Bitcoin price is consolidating as the US dollar starts to gain against key currencies. Last week, the dollar index closed higher for the second consecutive week. This strength happened as the currency strengthened against key currencies, including the euro and the British pound. A stronger dollar tends to push the price of Bitcoin lower.
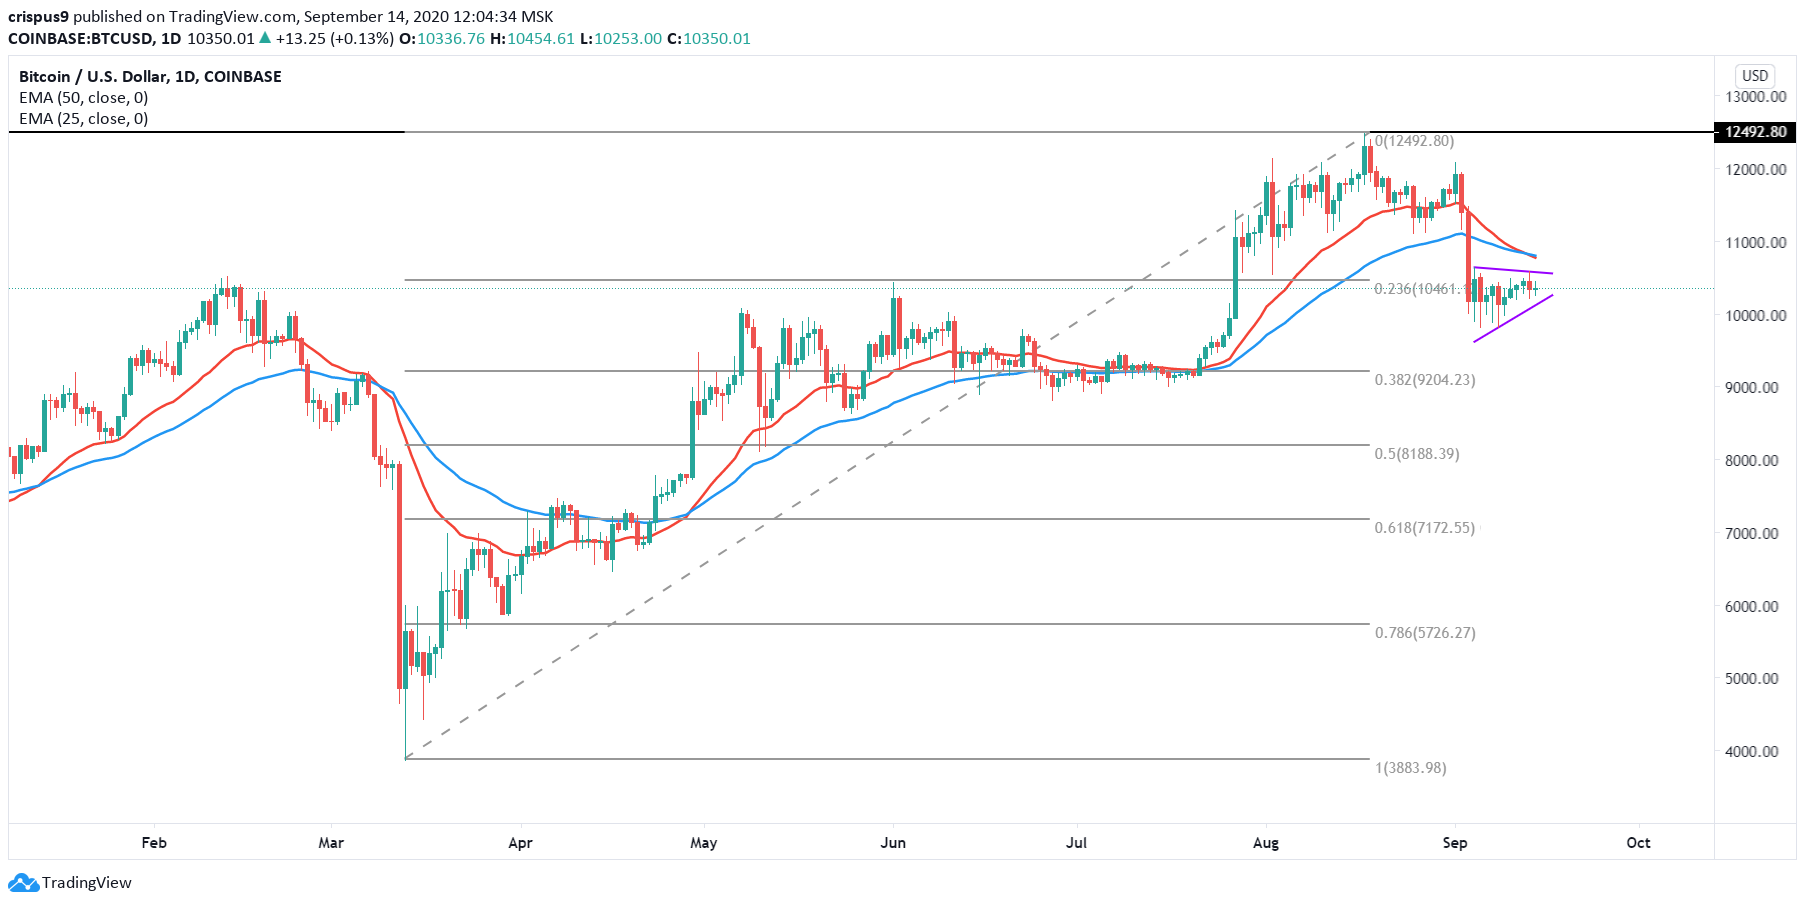
The daily chart shows that Bitcoin price reached a year-to-date high of $12,492 on August 17th. Since then, the price has been dropping and on September 5th, it reached a low of $9760. The price has been consolidating since that time and is now trading at $10,422.
The 25-day and 50-day exponential moving averages have formed a bearish crossover. At the same time, the price has formed what seems to be a bearish pennant pattern that is shown in purple. It is also along the 23.6% Fibonacci retracement level.
Therefore, this formation seems to be pointing towards a more pullback. If it happens, the price is likely to continue falling as bears target moves below the support at $10,000. On the other hand, a move above $11,000 will invalidate this trend because it will signal that there is still an appetite for the currency.
Start your trading journey with our free forex trading course and one-on-one coaching by traders and analysts with decades of experience in the industry.