- Summary:
- The Shanghai and Hang Seng index slipped this week as concerns about the Chinese economy continue. What next for the HSI index?
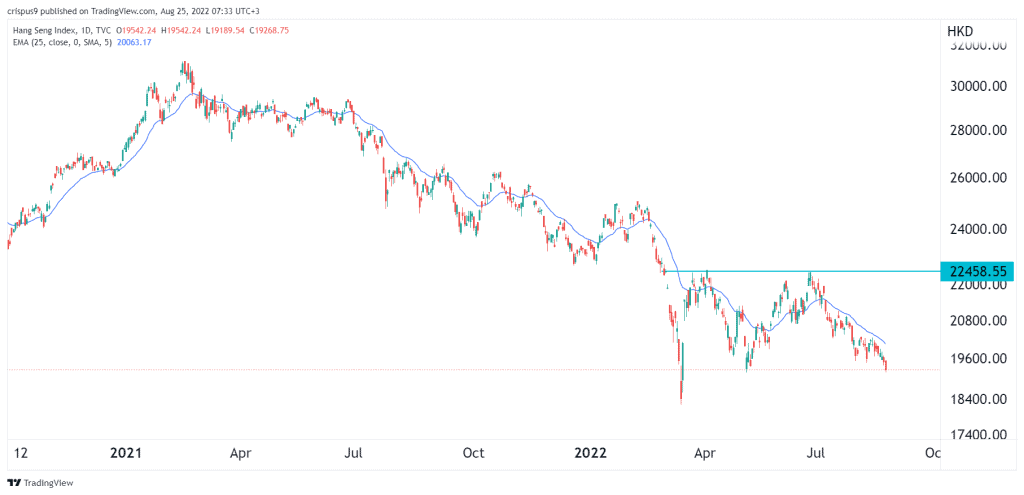
The Shanghai and Hang Seng index slipped this week as concerns about the Chinese economy continue. Hang Seng, the blue-chip index of top China companies, slipped to a low of H$19,300, which was the lowest level since May 10 of this year. It has crashed by almost 40% from its highest level in 2021.
China property bubble has burst
The Hang Seng index is made up of some of the biggest companies in China like Alibaba and Tencent. It is also made up of the leading real estate companies like Country Garden, China Land, and CK Asset among others.
The index has underperformed its global peers because of several key reasons. First, there are signs that the broad economy is slowing. In the past two weeks alone, the PBOC has slashed three interest rates in a bid to support the economy. This happened after a series of weak economic data on industrial production and retail sales.
Second, China’s property bubble has burst and analysts believe that the situation is much worse on the ground. For example, Evergrande, the second-biggest property company in the country, has come under intense pressure such that analysts expect that it will soon go out of business. This month, Country Garden warned that its profits will drop by 70% this year as people stop paying mortgages.
Meanwhile, China Overseas Land & Investment reported a 19% drop in earnings while Poly Property’s earnings fell by 9%. Therefore, the Hang Seng index has declined because of the rising risks of contagion in the property market.
Hang Seng index forecast
The daily chart shows that the Hang Seng index has been in a strong bearish trend in the past few weeks. It formed a double-top pattern at $22,458 whose neckline was at $19,245. In price action analysis, this is one of the most accurate bearish signals. The index remains slightly below the 25-day moving average and is also along the neckline.
Therefore, the HSI index will likely have a bearish breakout as bears target the year-to-date high of $18,292. A move above the resistance at $19,980 will invalidate the bearish view. This outlook is in line with that of InvestingCube’s S&R indicator, which you can subscribe to here.


