- Summary:
- Gold price declined on Friday as the US CPI was less surprising, meaning that September rate cuts will likely be minimal.
Gold prices rose to 4-week highs of $2,480 per ounce at the spot market on Wednesday before declining significantly as the traders reacted to the July US inflation data. The commodity’s price then fell toward the $2,450 territory at the spot market after the release of the July CPI figures. Earlier, the yellow metal came within touching distance of its all-time high of $2,484, with the futures market gold following the same trajectory to come within 0.1 percent of its all-time high price of $2,522. The two ATHs now present a psychological barrier whose breach could open up the path to a price rally.
CPI, Fed Interest Rates and global geopolitics favour gold
US Consumer Price Index (CPI) fell to 2.9 percent YoY in July, coming in less than the analysts’ forecasts that had projected it to remain unchanged from June’s rate of 3 percent. However, both the CPI and the Core CPI (excluding food and energy prices) came in at 0.2 percent on a monthly basis to match the forecast figures. These figures practically confirm that the Federal Reserve will announce the first interest rate cuts since 2020- a factor that is expected to weigh down on the US dollar. That said, the upside is limited for gold price based on inflation data alone, as the latest CPI figures did not divert much from the forecast figures.
Meanwhile, gold prices also enjoy support from the geopolitical tension in the Middle East and the Russia-Ukraine war that has recently taken a new turn following Ukraine’s surprise incursion into Russian territory.
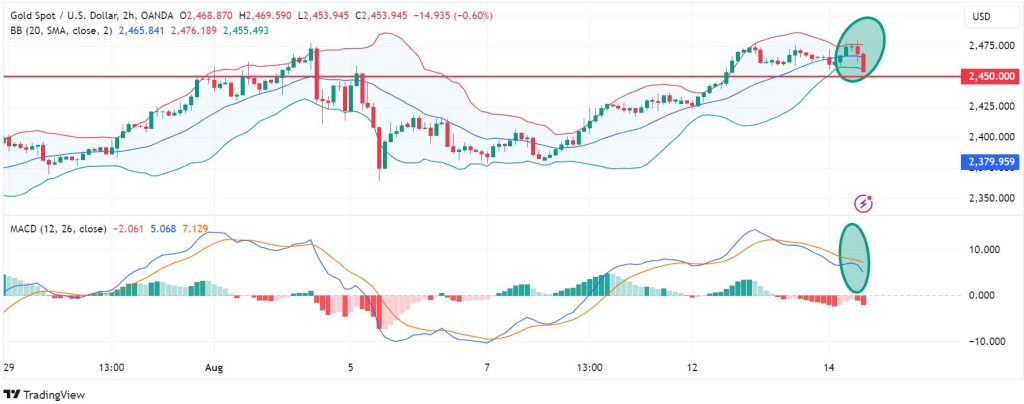
Gold price momentum
Gold price has recently crossed below the middle Bollinger Band on the 4-hour chart, signaling that control is shifting to the sellers. This is confirmed by the Moving Average Convergence Divergence (MACD) indicator line that has extended below the signal line. The next psychological support will likely come in at 2,450, and a break below that mark could strengthen the downward momentum further.
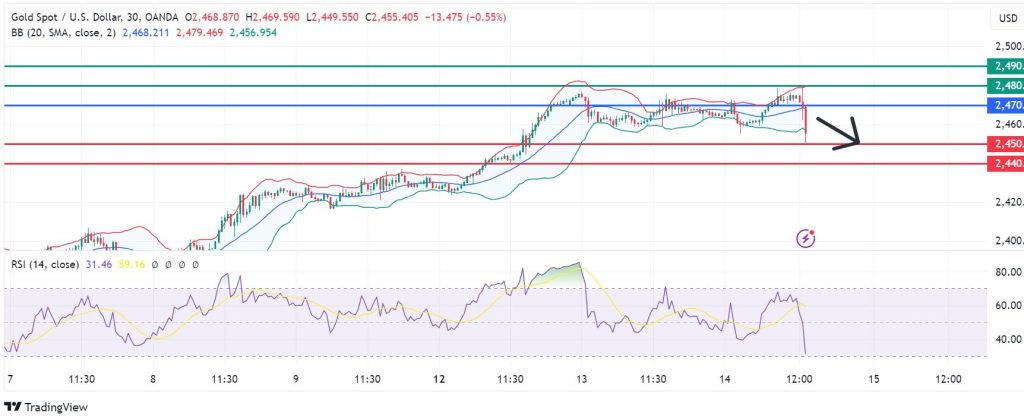
Key support and resistance levels
On the chart below, gold price looks likely to extend its decline if resistance persists at 2,470. With that, the first support could come in at 2,450. However, if the sellers extend their control, they could break below that level and test 2,440. Conversely, a move above 2,470 will favour the buyers to take control, in which case the first resistance could come at 2,480. However, extended bullish control could break above that level and invalidate the downside narrative. Also, that could extend gains to test 2,490.