- Summary:
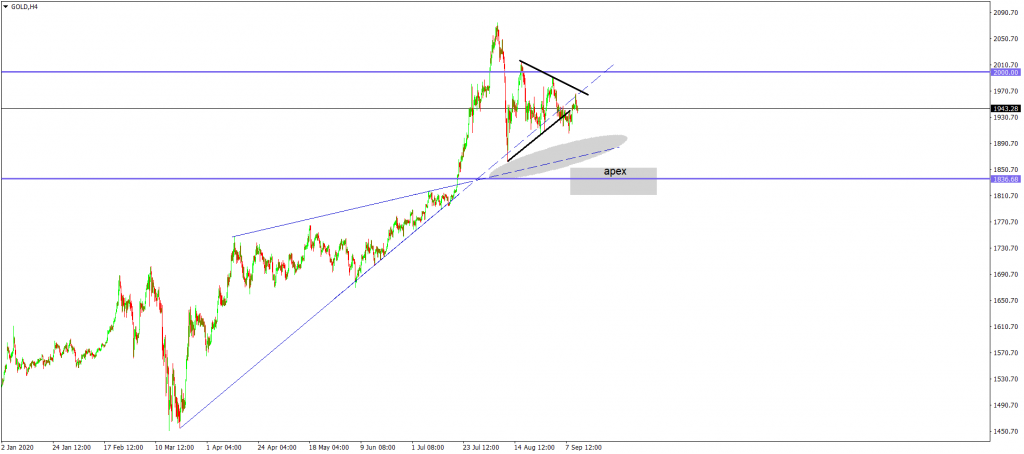
- Gold price forms a triangle as a reversal pattern and looks poised to revising the $1,800 area. The inability to hold above $2,000 weighs.
Gold price hovers just below the $2,000 without being able to push above the round number again—the inability to do so led to the formation of a triangle as a reversal pattern.
Gold led the USD lower trend we have seen recently. What is interesting is that the trend higher in the gold price started way earlier than the recent decline in the dollar.
Once again, gold did what it was supposed to do in times of crisis – it protected the portfolio from devaluation. As the USD fell, gold kept advancing at a faster rate and for longer, if we consider the start of the recent trend higher in the gold price.
Some Things to Consider When Looking at the Current Gold Price
Almost every time when gold advance, the strong trend on the yellow metal lead to a rise in the emerging markets’ stock market too. Not this time – emerging markets’ equities remain weak on the uncertainty brought by the coronavirus pandemic.
Another thing to consider before deciding to bid for gold at current values is the extent of the current rally. It outperformed the S&P500 by 40% in the past two years – a performance not delivered by many other assets.
Gold Price Technical Analysis
As mentioned earlier, the gold price finds stiff resistance at the $2,000 level. Moreover, each attempt at the level was met only with selling orders. As such, the market formed a series of lower highs and higher lows that seemed to have broken recently.
The last spike higher represents a retest of dynamic support turned resistance, and bears have enough ammunition here for a short trade at the market with a stop-loss order at the $2,000 and a take profit around the $1,800. While the risk-reward ratio is not that great, it still warrants an entry.
For more about how to trade and interpret alternative investments, consider our trading coaching program.
Gold Price Forecast


