- Summary:
- Gold price returned above the $2,400 mark on Tuesday, but still looks shaky on mixed fundamentals in the market this week.
Gold prices snapped a four-session losing streak on Tuesday, as XAU/USD roe by 0.4 percent in the intraday session to trade at $2,407 per ounce in the spot market. A returm above the $2,400 psychological support mark is crucial for the yellow metal, as it raises prospects of a reversal ahead of the much-awaited US PCE data release on Friday. Gold had been facing the prospect of further decline, as mixed sentiments around the US political space and the lack of safe haven attraction weighed in.
Yields on US government bonds have stagnated around the 4.200 percent mark in recent days, easing the pressure on non-yielding gold. Also, the odds of the Fed slashing interest rates in September have risen significantly, and that will see gold attracting more buyers. The June PCE data will be critical to defining the trajectory for gold prices.
Why $2,400 is a critical level
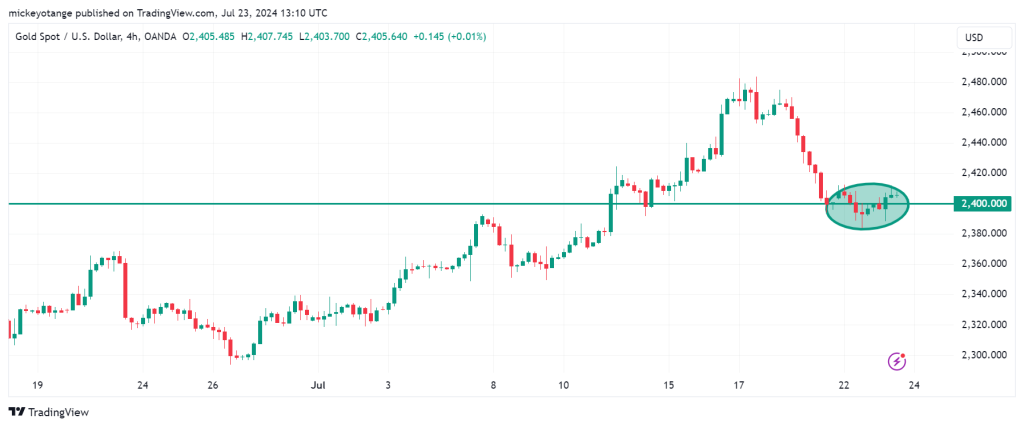
The 4-hour gold price chart below shows a reversal by gold price at the $2,400 mark. There have been minimal breaches below that mark, which have been followed by recovery to the upside. A rejection of prices below that mark is a bullish for gold prices and highlights this as a critical support level this week.

Momentum indicators
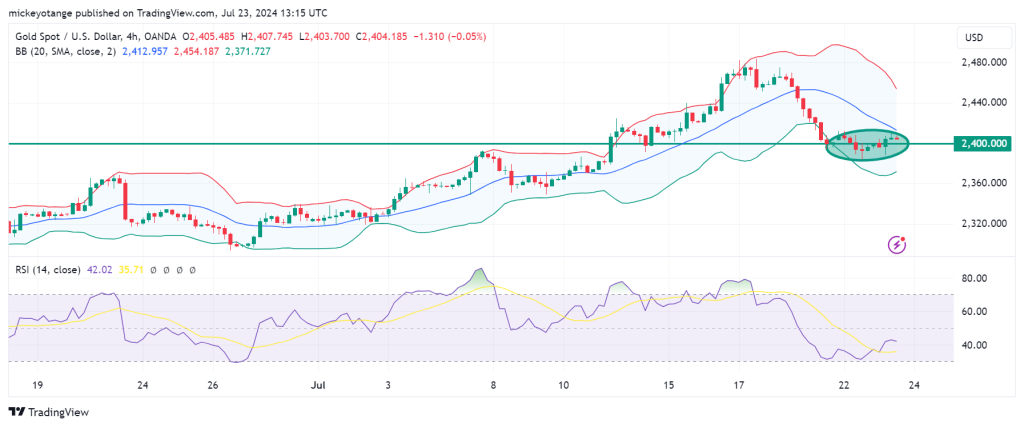
The Bollinger Bands indicator lends support for the view of the $2,400 mark as a key pivot level. As seen on the chart below, the price is currently just below the signal line. The $2400 mark was the point at which the price interrupted a chain of successive eight-red candlesticks.

Note that the last red candle on that descending chain was at the intersection of the $2,400 mark and the lower band. A break above the Bollinger Band signal line will solidify that mark as the support level.
On the other hand, the RSI is currently at 41, favouring control by the sellers.
Near-term support and resistance levels
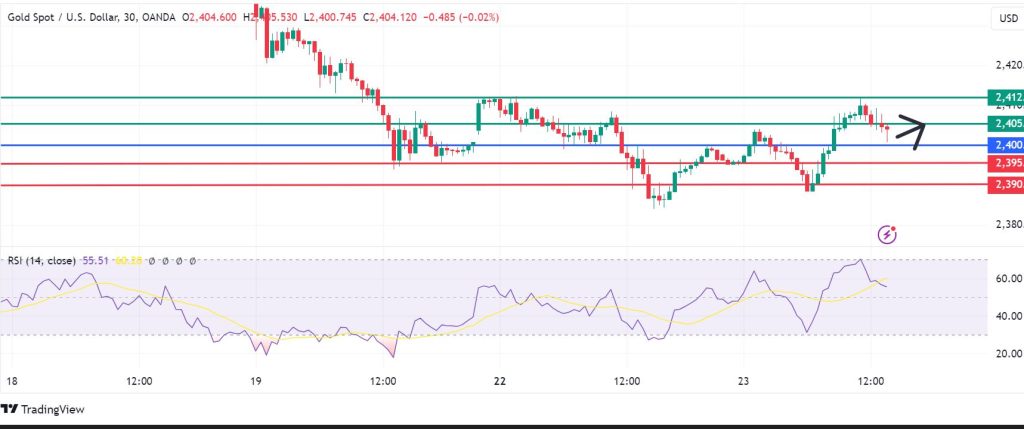
The momentum on gold price shows that the buyers will likely stay in control above 2,400. That could see them encounter the first resistance at 2,405, but extended control could enable the breaching of that barrier to take the price to 2,412. Conversely, a move below 2,400 will signal control by the sellers, with the first support likely to come at 2,395. However, sustained control by the could break that support, invalidating the upside narrative and potentially building the momentum to power further declines to test 2,390.


