- Gold prices eased from Tuesday's all-time-high. FOMC minutes may delay, but not deny further gains above $2,500.
Gold prices pulled back on Wednesday, easing from Tuesday’s all-time-high rally but staying above the $2,500 per ounce mark. The precious metal traded at $2,505 in the spot market at the time of writing, down by 0.3 percent on the daily chart. The subsidence is attributed to investors’ wait-and-see approach to the Federal Open Market Committee (FOMC) meeting minutes scheduled for release later on Wednesday, and expected to provide clues on the extent to which the Fed could reduce interest rates.
The yellow metal hit an ATH price of $2,531 on Tuesday, propelled by multiple factors. Gold price has followed a contrarian trajectory relative to inflation in recent weeks. While cooling inflation traditionally leads to lower gold prices, weak US economic data and geopolitical tensions have merged to polish the yellow metal’s glitter. Federal Reserve Chairman Jerome Powell will speak at the Jackson Hole Symposium on Friday, and his speech will likely influence financial assets’ trajectory for the most part heading into the last week of August.

In the meantime, yields on US Treasury bonds have fallen significantly, with the benchmark 10-year bonds returning 3.81 percent as of this writing. This is unlikely to threaten the price of non-yielding gold, and we could potentially see the metal trading within narrow margins of the current price.
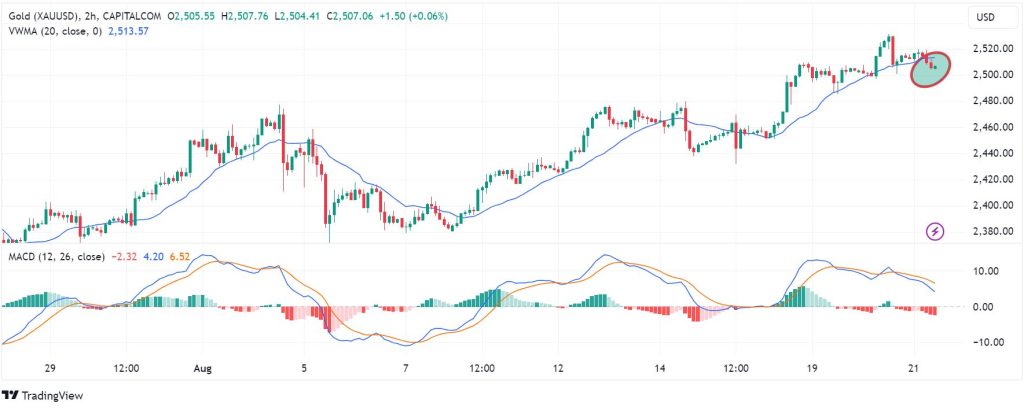
Gold price momentum
XAUUSD has broken below the Volume Weighted Moving Average line on the 2-hour price chart, signaling bearish momentum. Note that the VWMA level currently corresponds to $2,513, which means that the mark could potentially serve as the pivot mark in the near-term. Also, the MACD line is below the signal line, adding credence to the downward momentum narrative.
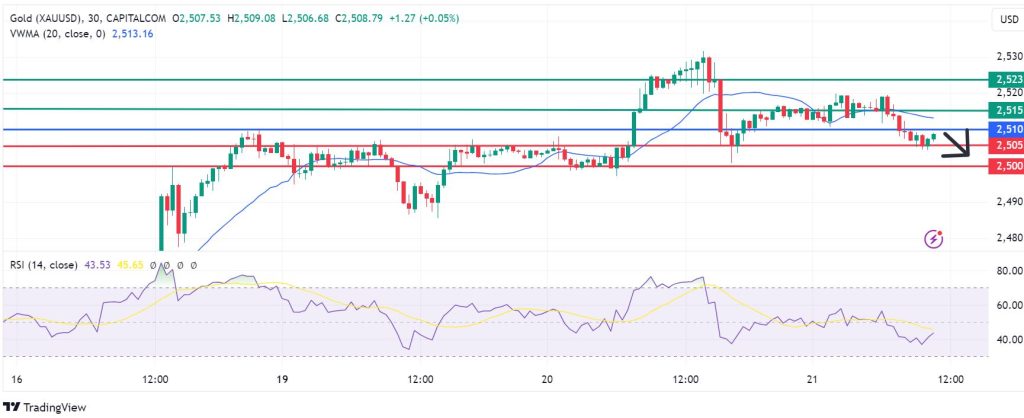
Support and resistance levels
The downside will likely prevail if resistance at the 2,510 pivot mark persists. In that case, the first support could come at 2,505. Moreover, if the sellers extend their control, they could breach that mark and test 2,500. On the other hand, moving above 2,510 will favour the buyers to take control. The upward momentum could encounter the first resistance at 2,515. However, extended control could enable them to break above that level, rendering the downside narrative invalid. Also, that could propel gold price higher to test 2,523.