
- The US has triggered a potential trade war with Europe as its ambition to get Greenland rubs its key trading partners the wrong way
- Demand for solid state gold is showing signs of weakening as elevated prices keeps some traders away
- Central bank purchases of gold are expected to continue strongly in 2026
XAU/USD Update: Late February – Early March Gold eases towards $5,000 support in a contrarian posture as the US dollar strengthens amid heightened Middle East conflict.
Gold has had a wild run, and the Middle East situation is adding fuel to the fire. After U.S. and Israeli action against Iran and confirmation of Ayatollah Ali Khamenei’s death, gold prices jumped past $5,400 today. With the Strait of Hormuz pretty much closed and oil prices going up, people are wondering how high gold can go.
Gold prices usually mirror the economy, and lately, the initial excitement cooled off as investors took their profits. The yellow metal usually rises when risk rises. Yet something odd unfolded lately. Conflict flared heavily in the Middle East, and instead of rising, gold dipped instead. Over five straight sessions, it slid downward. Prices dropped from over $5,400 an ounce to $5,083 as of this writing. Each day played out similarly. Early jumps on safety demand faded fast.
A stronger dollar dragged metal down each time and gains vanished by close. That has happened again and again and now confusion is growing. So what’s happening?
There is currently a convergence of three major factors driving gold price. They include trade tariff fears, ballooning US debt, central bank diversification away from the dollar, and a geopolitical risk premium fueled by tensions in the Middle East.
Is the US Dollar Winning the Safe Haven Competition?
Gold prices jumped in late February because trade tariffs fears just returned. When the U.S. Supreme Court rejected fast-track tariff powers, the president pushed back, hiking import taxes worldwide to fifteen percent. That move, called the Tariff Trap, rattled investors everywhere.
On February 20, fading greenback momentum along with ongoing purchases by central banks pushed gold past $5,000 yet another time. Fear spread fast across financial hubs from Tokyo to Frankfurt. People started buying gold like it was armor against chaos.
The initial decline in February stemmed from intense profit-taking following a record rally, with gold falling 3.9% in a session to $4,768.50 before rebounding. Kevin Warsh’s nomination as Fed Chair signaled a hawkish policy shift, strengthening the dollar and prompting sell-offs.
The conflict in the Middle East beginning in late February and spilling over to early March has raised gold’s geopolitical risk premium. With the conflict still escalating, the likelihood of a new all-time high in the near time is really high. Also, fears that AI might mess up the economy have led people to pull money out of growth stocks and invest in safer things like gold.
Despite struggling in recent days, gold hasn’t lagged because it lost its appeal when markets get shaky. What’s shifted is how fiercely another haven has stepped up during these times. The U.S. dollar index saw a significant 1.24% jump last week, underlining the green back’s growing attraction. Since gold trades in dollars, that surge lifts prices for buyers holding different currencies. As those costs climb, interest across world markets tends to fade.
Gold faces another challenge, one deeper than most realize. War in the Middle East shifted things oddly. Inflation worries climbed, yet chances for quick interest rate drops faded, a rare mix hard on gold. Without yield, gold struggles when rates rise. Now, U.S. 10-year bond returns have grown, reaching levels not seen lately.
Gold Price Outlook and Trade Tariff Risk
Gold’s sensitivity to changes in the dollar and policy suggests caution in the face of economic uncertainty, and this volatility suggests a mixed prognosis. Although geoeconomic uncertainty is driving gold as a hedge and risk sentiment is still high, the recovery points to selective optimism.
But the “consensus” often overlooks this special value proposition, the “Shanghai Discount.” The global market has historically been led by a premium in Chinese gold prices. The fact that that premium has now turned into a discount indicates that the speculative foam is being removed.
Earlier in January, US President Trump sparked a fire in the markets after threatening tariffs against America’s top European trading partners. Germany, the United Kingdom, France, Netherlands, Sweden, Finland, Norway and Denmark could face an initial 10% tariff on their exports to the US starting February 1, 2025, and potentially rising to 25% by June. However, that rhetoric is no longer in play following the calming of relations after NATO agreed on a framework for a future Arctic security deal.
Nonetheless, the current gold price recovery signals lingering uncertainties in the global economy, where investors seek havens amid potential slowdowns. The World Gold Council’s 2026 forecast, released on December 4, 2025, predicts gold could gain 5-15% if rates drop more, or 15-30% if there’s a big downturn.
This also reflects worries about changes in US policy. Even with a stronger dollar, gold is going up. It suggests people are losing trust in the financial system. Investors aren’t just protecting against inflation; they’re protecting against the world becoming more divided.
How Far Can Gold Rise From Here?
The medium-term bull case remains intact. Qatar’s Energy Minister told the Financial Times that he expects all Gulf energy producers to shut down exports within weeks. Such a scenario could drive oil to $150 a barrel, reigniting the inflationary impulse in a way that eventually forces investors back into real assets.
Gold price might climb to 5,500 or more, though certain experts see it reaching above 7,000 should inflation spike or conflicts worsen. If peace efforts gain ground or the dollar holds firm, prices could slip below $5,000 instead. Gains in the short run look small unless unrest grows, yet a robust dollar stands ready to hold back upward moves.
Beyond the headlines, structural shifts are doing the heavy lifting. Central banks, especially in China and Poland, are buying less U.S. dollars and more gold, according to data from World Gold Council and Goldman Sachs. When big banks start stocking up on gold instead of cash, prices tend to increase. These factors have pumped up the propulsion on gold price.
Some see gold’s recent volatility as a bad sign, but smart, experienced investors see it as the market getting a reset. If the main reasons for gold’s rise, including central bank buying and worries about government debt stay the same, the recent slowdown is just a pause before another rise.
Gold hit $5,595 back in January 2026, and after that, the market took a breather. Now, that peak price seems within reach again. City Index analysts think we might see those levels again soon if the conflict gets worse.
But I think that many people believe gold only goes up when people are scared. While that’s part of it, the real reason is that bonds aren’t as appealing anymore. When the U.S. is at war, people start to question how safe things like bonds really are. Gold isn’t just a safe place to put your money right now; it’s a sign that people don’t trust the global financial system when things are so unstable.
If gold closes above $5,320 this week, it’s heading toward $5,596, the old record high. It was already trading above that during the day on Monday. If the conflict doesn’t calm down before the week ends, a new record seems like a sure thing.
Gold Technical Analysis: Bullish Structure Intact, RSI Signals Caution
From a technical perspective, gold’s broader trend remains bullish. XAU/USD continues to trade above its 100-day Exponential Moving Average, confirming that the longer-term structure is still intact.
However, momentum indicators suggest near-term caution. The 14-day Relative Strength Index remains above 70, signaling overbought conditions and increasing the likelihood of consolidation before the next directional move. Bollinger Bands remain wide, indicating that volatility expansion remains possible once liquidity improves.
Key Technical Levels to Watch
- Immediate resistance: Record high at $5,600
- Next upside target: Psychological level at $6, 000
- Initial support: $5,100
- Secondary support: Psychological level at $4,900
- Broader support zone: $4,500.
A sustained break above $5,600 would likely confirm another leg higher, while a move below $5,000 could trigger a deeper but still corrective pullback.
Will Gold Stay Above $5,000 Per Ounce In 2026?
The consensus among the top analysts on Wall Street is a resounding “yes.” Citigroup’s analysts just raised their 90-day target to $5,000, which suggests we might see that price before spring. J.P. Morgan and Goldman Sachs are a bit more conservative but still optimistic. They predict an average of about $5,055 by the end of 2026.
The structural engine behind this is central bank demand. According to the World Gold Council, nearly 95% of central banks surveyed intend to increase their gold reserves this year.
While most analysts see the $5,000 level as a temporary ceiling, institutions like Wells Fargo have recently upgraded their targets to a staggering $6,100–$6,300. The narrative has shifted. Gold is now a key asset for a world worried about debt and trade wars, and not just a safe haven for tough times. If central banks keep buying, $5,000 could be a stable price point for gold. But some thinks that higher tariffs could change things if the dollar gets stronger.
Gold buying by China’s central bank carried on into January, marking more than 15 straight months of purchases, figures from the People’s Bank of China show, as reported by Bloomberg. With unrest flaring across the Middle East and questions lingering about American trade moves, investors are turning to assets seen as stable havens.
Daily moves on the COMEX may hinge on paper trades, yet data from Brave New Coin shows warehouse stockpiles dropping to alarming lows. Central banks in places like China and India aren’t simply adding gold as backup – they’re swapping it into their core holdings instead of dollars. Should real-world appetite keep growing faster than what mines produce, $5,000 per ounce might mark the bottom rather than a high point , even if global conflicts ease.
Long-Term Gold Price Forecast: 2026, 2030 and 2040
Gold has entered 2026 with a strong momentum overflow from 2025, and the long-term outlook has shifted meaningfully as monetary policy, central bank demand, and global risk cycles evolve. Below is an updated, SEO-optimized long-term gold forecast built around the latest market trends, Fed expectations, and structural drivers shaping XAU/USD going forward.
Gold Price Outlook 2026: What Traders Should Expect Next
Looking ahead to 2026, the outlook remains constructive. A potential leadership shift at the Fed, Greenland-related US-Europe trade war, slower global growth, and persistent demand from China and emerging-market central banks all support a long-term bullish narrative. If the dollar weakens further and the easing cycle deepens, gold could extend its multi-year uptrend, with dips increasingly treated as opportunities for accumulation.
Even though $5,000 is a big deal, many think this is just the beginning. Metals Focus analysts say that even if some people sell to make a quick profit, gold prices are now set on a higher level. Bank of America forecasts that gold could hit $6,000 by spring 2026, because people are losing faith in regular investments. Goldman Sachs now predicts gold will end the year at $5,400, as more regular investors start buying in line with the central banks.
Can $6,000 Become Support?
The question as to whether $6,000 per ounce could become the new support is the more consequential question, and the structural case is quite credible. Bank of America analysts forecast that gold price could reach $6,000 by spring 2026 as people lose faith in regular investments. Wells Fargo just upped its targets to $6,100–$6,300, and JP Morgan’s commodity desk is saying gold could hit $6,300 by December 2026.
For $6,000 to stick, central banks need to keep buying gold like they have been doing for the last several months. Currently, they’re buying the yellow metal at levels we haven’t seen since the ’70s. If countries keep moving away from the dollar to avoid issues like sanctions, there will be a strong demand for gold. But don’t expect it to be a smooth ride. If gold hits $6,000, a lot of people will probably sell to make a profit.
Risks to Gold Price in 2026: Is a Reversal Possible?
Of course, no rally goes up in a straight line. The biggest danger for gold right now is a drop in demand. At $4,690, jewelry buyers, who usually make up a large part of gold demand, are starting to pull back. Morgan Stanley analysts point out that if the U.S. and Europe quickly resolve the Greenland issue, the fear factor could disappear, leading to a quick price drop.
Also, a stronger U.S. dollar or lasting high interest rates, caused by rising inflation that could push the Fed to tighten policy, could make real yields rise and reduce gold’s attractiveness.

Key drivers for 2026:
- Fed policy transition: If the new Fed leadership leans dovish or signals tolerance for higher inflation, gold could retest or exceed the $4,300–$4,380 levels reached in 2025.
- Central bank accumulation: China, India, Turkey and other EM central banks continue diversifying away from the dollar, providing a long-term floor for XAU/USD.
- Geopolitical rotation: With tariff tensions, global elections and shifting alliances, safe-haven flows are likely to remain elevated.
- Real yields: Any sustained decline in US real yields historically triggers multi-month upside in gold.
2026 forecast range:
- Base case: $4,400–$4,750
- Bull case: A break above $5,000 if rate cuts accelerate and geopolitical risk heats up
- Bear case: $3,700–$3,950 only if inflation cools faster than expected and the dollar stages a major recovery
It’s easy to get caught up in the excitement, but there are a couple of things that could bring gold down. First, if there’s a big panic in the financial markets, investors might sell their gold to cover losses in other assets, like stocks.
Second, if there’s a sudden peace agreement or a truce among the belligerent parties in the Middle East, the war premium could disappear quickly, and prices could fall back to around $5,000, according to Bloomberg.
Overall, gold’s path into 2026 remains upward-biased, with dips likely to be viewed as accumulation opportunities.
Gold Price Forecast 2030: What Could XAU/USD Look Like by the End of the Decade?
Long-term gold forecasting is driven less by short-term economic data and more by structural trends that unfold over years: dollar cycles, global central-bank reserves, fiscal deficits, and commodity supply constraints.
Macro themes shaping gold into 2030:
- Persistent fiscal deficits in major economies increase long-term inflation risk.
- A structurally weaker US dollar would support higher gold prices over the decade.
- Central bank diversification away from USD assets is accelerating, especially across emerging markets.
- Slowing mine supply growth and rising extraction costs are tightening the physical market.
- Global uncertainty cycles, US elections, EU fragmentation, China’s long-term growth shift, historically fuel gold demand.
Based on these factors, updated for 2025 conditions, a realistic long-term view is:
2030 forecast range:
- Base case: $5,500–$6,000 per ounce
- Bull case: $7,000+ if the dollar enters a multi-year decline and EM reserve buying accelerates
- Bear case: $4,500–$4,800 if inflation collapses and real yields surge
Most likely scenario:
Gold steadily grinds higher, supported by structural deficits, geopolitical risk cycles and steady central bank buying.
Gold Price Forecast 2040: What Could XAU/USD Be Worth in the Next Global Cycle?
Forecasting gold 15 years ahead requires anchoring on mega-cycles rather than short-term events. These cycles include technological demand shifts, monetary trends, demographic changes and long-term economic realignments.
Factors shaping gold by 2040:
- Declining global trust in fiat currencies as governments run larger and more frequent deficits
- Peak-gold supply concerns, with mining output expected to plateau or decline
- Continued de-dollarization, especially if multi-currency settlement systems expand
- Higher global wealth, particularly in Asia, driving long-term physical demand
- Climate, energy and political instability cycles, which historically increase safe-haven demand
Gold 2040 forecast range:
- Base case: $8,500–$10,000 per ounce
- Bull case: $12,000–$15,000 if global monetary systems experience significant stress or persistent inflation
- Bear case: $6,000–$7,500 only if real yields remain structurally high and global stability improves materially
While long-dated forecasts carry uncertainty, the direction of travel is consistent: gold tends to outperform in periods of fiscal instability, geopolitical tension and monetary easing, all of which are likely themes over the next 15 years.
Gold Price History and Long-Term Trend Analysis (1970–2025)
Gold’s long-term trend from 1970 to 2025 shows a steady upward trajectory driven by inflation cycles, dollar weakness, and periods of global uncertainty. Major breakouts in 1980, 2011, 2020, and again in 2025 highlight how gold consistently gains value during economic stress and loose monetary policy. The multi-decade pattern remains intact, reinforcing gold’s role as a reliable long-term store of value.
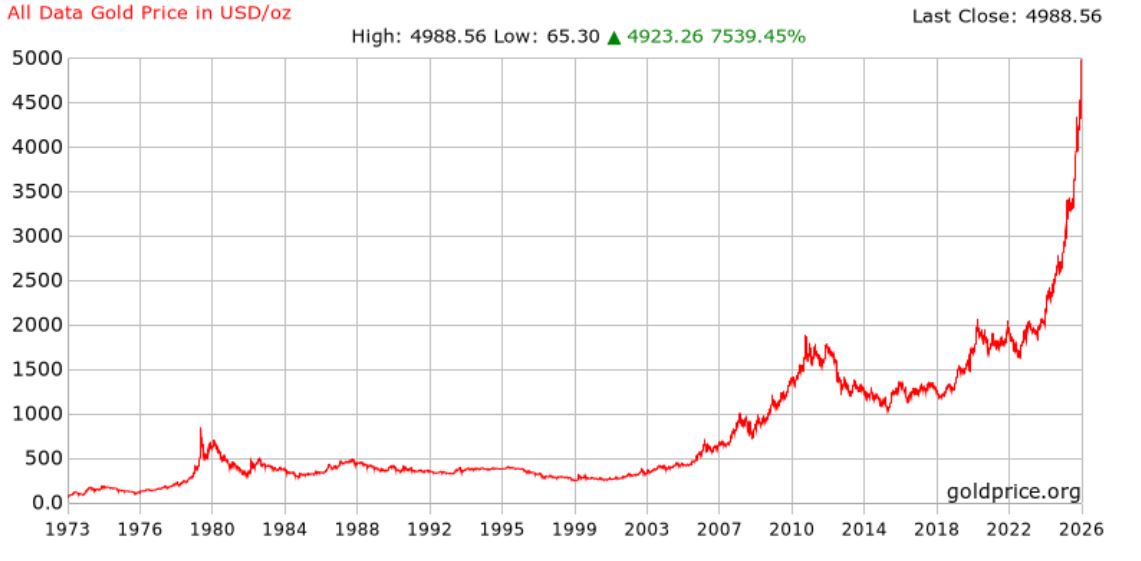
Gold Price Historical Chart
In August 2020, gold surged to a then-record high of $2,072.85 as the pandemic drove global investors into safe-haven assets. Although prices corrected afterward, the metal held above the $1,600 zone throughout 2021 and early 2022, supported by strong physical demand and persistent macro uncertainty.
Gold briefly dipped toward $1,616 in late September 2022 during the Federal Reserve’s most aggressive rate-hiking cycle in decades. But once inflation began moderating in 2023, XAU/USD entered a steady uptrend, breaking through $2,000 again in early 2024 and accelerating sharply into 2025. By mid-2025, gold had cleared multiple record highs, peaking above $3,700 after the Fed’s first rate cut, and remains elevated above $4,200 as 2025 closes.
Gold Rate In India Today
Gold prices in India continue to reflect strong global momentum, with 24-carat purity rates hovering near record highs. Demand remains robust ahead of the festive season and wedding-related purchases, fueling both retail buying and jewellery demand.
Meanwhile, the weak rupee, pressured by a softer US dollar internationally and firm domestic gold demand, adds an extra layer of strength to local gold rates. For investors and traders watching the gold market, the combination of surging global XAU/USD and favorable currency dynamics makes Indian bullion especially attractive right now.
I’ll keep posting my updated outlook on Gold and other assets in my free Telegram group, which you’re welcome to join.
How To Invest in Gold
One of the viable ways to invest in gold is by buying bullion. It may be in coins or bars, certified with purity and weight have. Then, one can purchase or sell the physical gold to a reputable dealer. However, security reasons often lead some investors to embrace the route of futures and options.
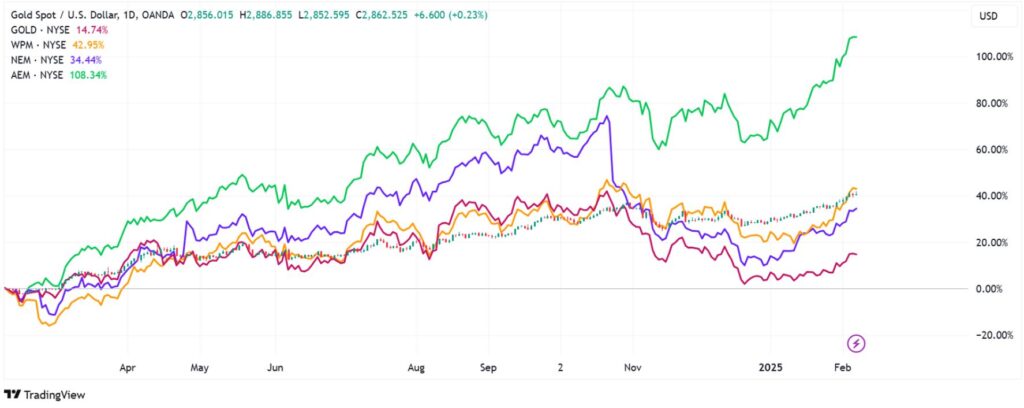
Best gold stocks to invest in
One of the best ways to invest in gold is through stocks. In the past few years, mergers and acquisitions in the sector has led to a significant consolidation in the sector. Today, only a few large companies dominate the industry.
Barrick Gold, a company valued at $30 billion, is one of the best gold stocks to invest in. Its stock has risen by 21% in the last year and is up by dropped by about 8.1% year-to-date. The other excellent stock to buy is Wheaton Precious Metals, which is worth over $28 billion. Unlike other gold companies, Wheaton does not do the real mining. Instead, the company has purchased rights for key gold assets.
The other best gold stocks to invest in are Newmont Corporation, and Agnico Eagle mine. The chart below shows the performance of some of the biggest gold stocks in the industry.
Gold Futures
Futures are contracts in which one agrees to buy or sell the financial asset at the agreed-upon price before the expiry of the contract. For options, the investor has a chance and not an obligation to buy or sell the underlying instrument for as long as the contract is valid. To invest in gold via futures and options, one needs an account with a reputable financial broker. It is possible to trade in gold for a commission through the brokerage account.
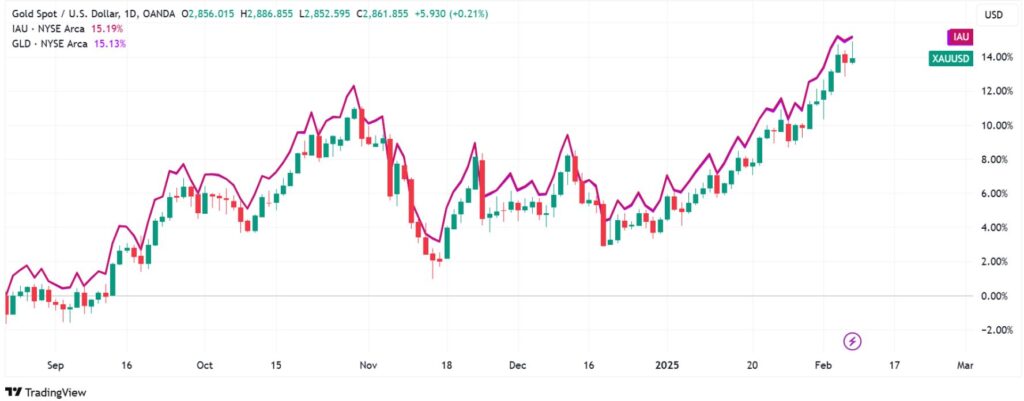
Gold ETFs
ETFs and mutual funds are yet another viable way to invest in gold. A share of this financial instrument represents a specific amount of gold. One needs a brokerage account to trade in gold ETFs or mutual funds, like in futures and options.
In addition to the aforementioned ways of investing in gold, an investor can consider buying stocks of gold mining companies like Barrick Gold Corp. (GOLD) or Newmont Corp. (NEM). While the share price is usually correlated to gold price, the firm’s fundamentals are also influential.
The chart below shows two of the most popular gold ETFs, the iShares Gold Trust and SPDR Gold Trust. As you can see, these ETF tend to move in sync with gold prices.
Gold Price FAQs
The crash was triggered by the nomination of Kevin Warsh as the new Fed Chair. His hawkish stance bolstered the US Dollar and sparked massive profit-taking after gold hit a parabolic peak of $5,595.
Central banks, with China in the lead, are buying gold to reduce their reliance on the US Dollar. J.P. Morgan says these banks are likely to buy about 755 tons in 2026, which should support gold prices.
Most forecasts expect gold to climb further in 2026 as central banks continue buying, US rate cuts deepen, and global uncertainties persist.
Most people are very optimistic about gold. Wells Fargo and J.P. Morgan predict prices will go above $6,000 per ounce. They believe that the value of regular currencies is decreasing and that global political problems will keep pushing gold prices up.
This article was originally written in December 2024 and is regularly updated to reflect the latest gold market trends and price action