- Summary:
- Gold price trades higher today after yesterday tested and rebounded from the 50-day moving average. Recent economic data shows that the recovery has stalled
Gold price trades higher today after yesterday tested and rebounded from the 50-day moving average. Recent economic data shows that the recovery has stalled in August. The U.S. Initial Claims for unemployment benefits came at 860,000 during the week of September 12th, worse than the expectation of 850,000. The previous week figure was at 893,000.
On Wednesday the Federal Reserve kept the interest rates and the Q.E. programme unchanged. It also revised higher the projections for the U.S. economy. Fed now expects that the U.S. economy will shrink by 3.7% in 2020 below the previous forecast of a contraction of 6.5% while now the unemployment rate is expected at 7.6%. Now analysts believe that the Fed will not increase interest rates until 2021 and that is good news for gold.
Yesterday, the Bank of England also revised higher it’s projections for the U.K. economy but also said that the committee discussed the impact of negative interest rates in the economy.
The low-interest rates environment sketched in the USA, Japan, and the U.K. makes holding gold more attractive as gold is a non-yielding asset. Above that monetary policy that accepts higher inflation also supports gold as investors have the precious metal as a hedge to higher inflation rates.
Gold Price Technical Analysis
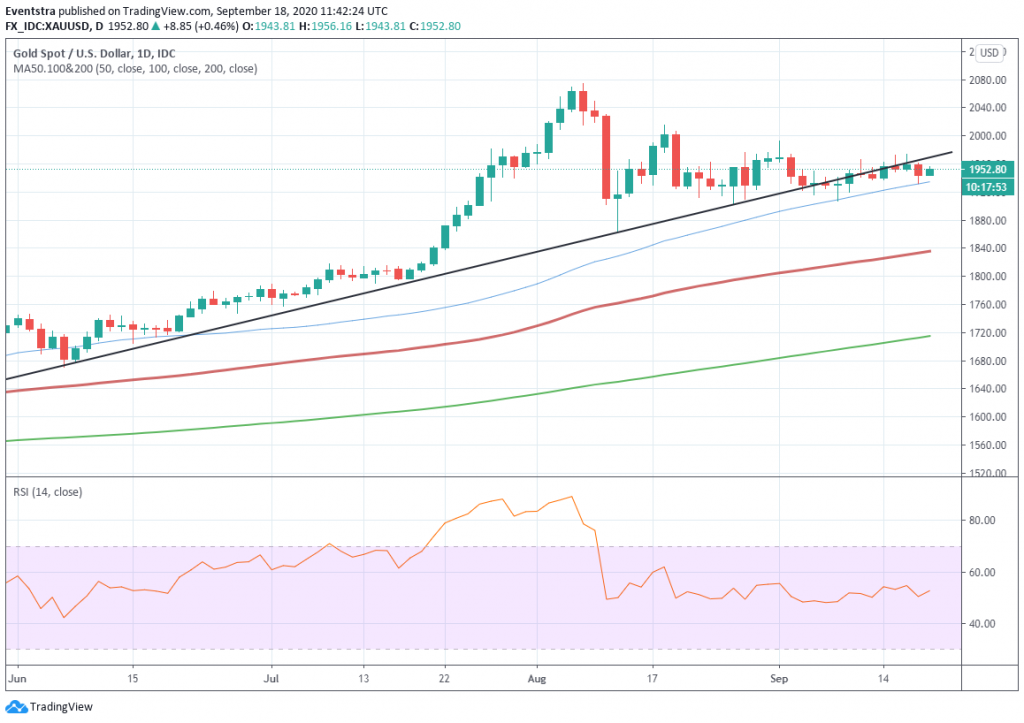
Gold price is 0.43% higher at 1,952, as the consolidation phase continues looking for a break in either direction. Fed failed to provide that catalyst earlier on the week. The gold price has breached below the upward trend line that drove the precious metal to record highs from the March lows, losing some of the momentum.
The technical outlook for gold is still bullish as long as it holds above the 50-day moving average. In case the gold price breaks below the 50-day moving average support, then the next level to watch is 1,908 the low from September 8. The August low at 1,862 would provide the next support.
On the other hand, resistance for gold is at 1,962 the high from yesterday’s trading session. A break above might challenge 1,992 the high from September 1. The top from August 18 at 2,015 is the next supply zone.
Gold Price Daily Chart


