- Summary:
- Gold price forecasts remain bearish despite the two-day gain seen in the XAU/USD price charts, ahead of next week's FOMC decision.
Gold price forecasts in the short term remain bearish, despite the 0.48% uptick seen in Tuesday’s trading session. This upward push in price comes on the back of generalized USD weakness seen on Monday and Tuesday, as traders bullish on the greenback started to bank profits.
Investors moved back into riskier assets as the Fed goes into silence mode ahead of its 28 July interest rate decision. Gold price forecasts turned negative as the Fed embarked on an aggressive monetary policy pathway, hiking by 75bps when the market expected a 50bps hike in June.
Some analysts now believe the Federal Reserve could hike by as much as 100 bps next week, given the stellar jobs report and 9.1% consumer price index figure that meant that US inflation stayed at 40-year highs. An emerging pattern on the daily Chart could point to renewed weakness.
This scenario could see gold giving up some of the gains being registered in the days ahead, marking a return to more negative gold price forecasts. For now, gold prices on the XAU/USD continue to stay in the downtrend, and any rallies could be seen as opportunities to build up new positions at better XAU/USD prices. However, a push above 1745.52 keeps the bulls in business. Here is the gold price forecast ahead of the FOMC decision in nine days.
Gold Price Forecast
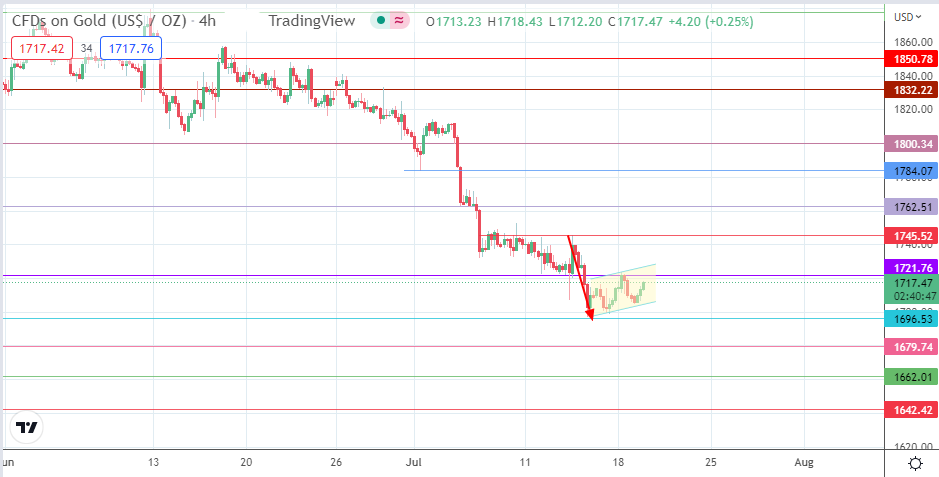
The emerging bearish flag on the 4-hour Chart points to the potential for a continuation of the downside move. This could come from a rejection of price action at the 1721.76 price mark. This rejection and pullback move has to break down the flag’s lower border and the 1696.53 support to complete the pattern, targeting a measured move that should attain completion at 1662.01 (21 April 2020 low).
To attain completion, this move must break down the 1679.74 support line (30 March 2021 low). An additional target below this point comes at the 1642.42 support level (7 April 2020 low). On the flip side, a break of the 1721.76 resistance and the flag’s upper border invalidate the pattern.
This scenario will see the bulls targeting 1745.52 (13 July 2022 high) as the next upside target. 1762.51 comes in next, being the site of a previous low seen on 5 July 2022 that now acts in role reversal. Finally, additional price targets to the north are found at 1784.07 (1 July low) and 1800.34.
XAU/USD: 4-hour Chart


