- Summary:
- Gold prices could see the first monthly decline since January as investors weigh implications of Fed rate decision and China buying pause.
Gold prices declined on Tuesday as US GDP jitters continued to provide fodder to sellers. The yellow metal traded at $2306 per ounce after going down by 0.22 percent in the intraday session. The commodity is down by 0.9 percent in June, and could be on track to print its first monthly red candlestick since January.
After four months on the rise, gold’s upward momentum seems to be running out of steam. With the Federal Reserve expected to retain the current 5.25-5.50% interest rates in its Wednesday meeting, gold will remain under pressure in the near term. Furthermore, May’s upbeat Non-Farm Payrolls figures have fortified the dollar against an onslaught by competing assets.
Outside the United States, China’s central bank halted purchases of gold in May- the first time in one and a half years. This has far-reaching repercussions on gold’s demand, and could trigger a market correction. One of the key drivers behind China’s gold buying spree was the widespread fear that the world’s second-largest economy was staring at a steep decline in growth and possibly overexposed to US dollar fluctuations. However, recent data has shown that China’s economy is resilient and registering impressive growth figures.
A break below the $2,300 psychological support mark is telling, considering that gold has spent only 9 days below that level since April 6. Notably, geopolitical pressures in the Middle East played a crucial role in keeping prices elevated. However, gold’s safe haven appeal is likely to diminish, after the UN Security Council backed a new ceasefire plan for Israel and Hamas. That said, investors will be watching the EU parliamentary elections for cues on possible geopolitical fuel for gold prices.
Technical analysis
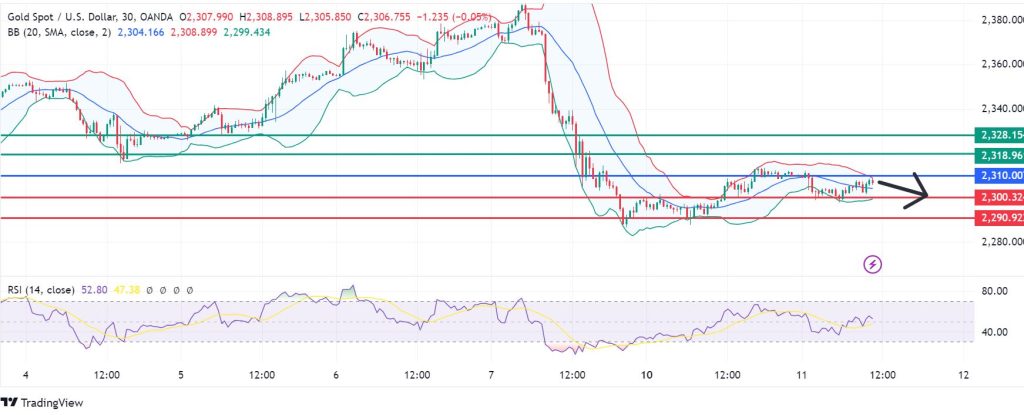
Gold price is currently neutral-to-bearish-leaning, with the pivot point at $2,310. The downside will likely continue if resistance remains at that mark, and the first support could come at $2300.32. Furthermore, an extension of control by the sellers at that point will likely break the support and potentially build the momentum to test $2,290.92. Conversely, a move above $2,310 will signal control by the buyers, who will encounter the next resistance at $2,318.96. A breach of that level will invalidate the downside narrative and could result in a stronger upward momentum to test $2328.15 in extension.


