- Summary:
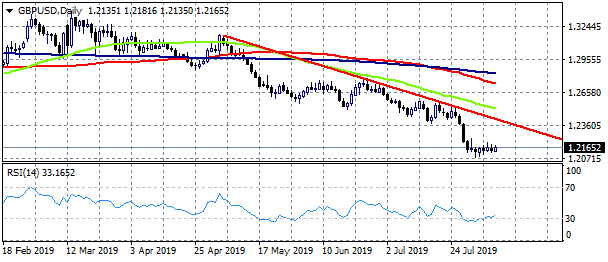
- GBPUSD fights to fly away from recent lows at 1.2078 as sellers are in control. The pair in the daily chart trades sideways in a rectangle which usually is
GBPUSD trades 0.13% higher at 1.2155 in a well established trading range between 1.2135 to 1.2181. In the hourly chart the pair looks trapped between the 50and 200 hour moving average, with traders indecisive in what will be the next move.
GBPUSD fights to fly away from recent lows at 1.2078 as sellers are in control. The pair in the daily chart trades sideways in a rectangle which usually is a continuation pattern. So a break lower is a possible scenario. On the upside immediate resistance stands at 1.2181 the upper bound of the rectangle while more offers will emerge at 1.2380 the descending trend line from May 6th. Intraday traders can enter a long position if the pair breaks above 1.2182 targeting a break above 1.22, a stop order should be activated at 1.2133. Short positions should target the levels below 1.21 and at 1.2050 but have to place stop loss orders at 1.2187. All in all the momentum is bearish and a move lower is the most possible scenario; but as the RSI 14 in the daily chart has reached oversold levels at 30.04 and stabilizes there is a possibility for the pair to make a rebound above 1.22 if manages to break above 1.2183.


