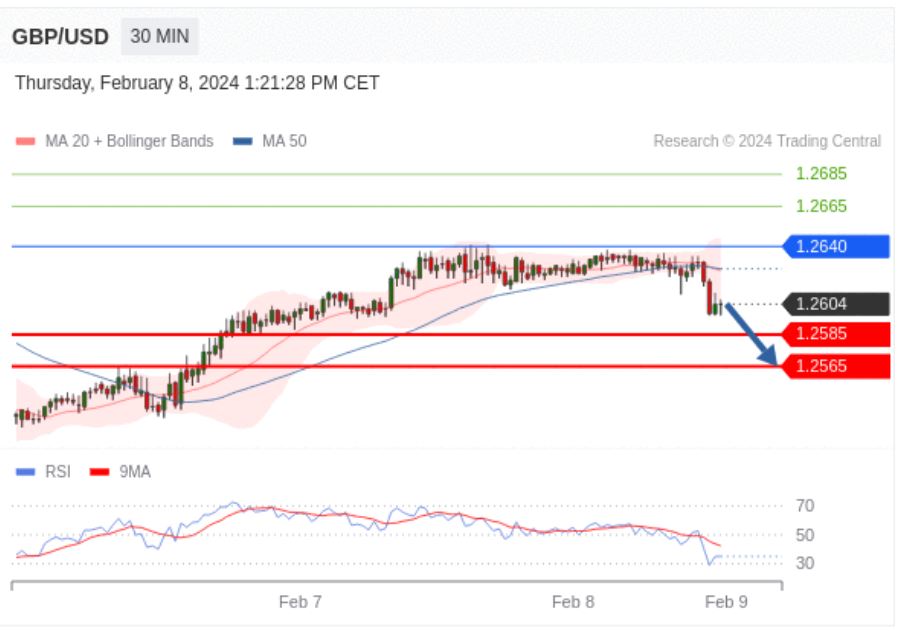
GBPUSD has lost further ground as the market turns bearish amidst strong US dollar fundamentals. The pound was trading at 1.2594 against the dollar at 13:30 GMT, having gone 0.27% under its opening level. The 10-year US Treasurys yields have inched higher to stand at 4.15% at the time of writing, further bolstering bearish views against the GBPUSD trading pair.
The dollar has had a strong run over the past week, propelled by a series of strong US economic data. Furthermore, the Fed has maintained its hawkish tone this week, with individual speeches by three FOMC members reiterating reluctance to cut rates in Q1.
The upward momentum by the US dollar is likely to continue, following another positive showing by the US economy. The US Department of Labour released better-than-expected initial jobless claims data on Thursday. The reading came at 218,000, below the forecast 221,000, and strengthening bullish sentiment for the dollar. In addition, the continuing jobless claims came at 1,871k, lower than the consensus 1,878k.
GBPUSD is unlikely to shift significantly when Dr. Catherine Mann, a member of the Monetary Policy Committee (MPC) of the Bank of England (BOE), speaks later in the closing hours of the London session. With the UK Halifax House Prices for January having risen by 2.5%, many analysts expect Mann to echo an earlier hawkish statement by the BOE Deputy Governor, Sarah Breeden. However, a divergence by her could help the GBP salvage some gains heading into the weekend.
Technical Analysis
The RSI momentum on the 30-minute chart signals a likelihood of a downside action, with the indicator below the 9MA. The bearish momentum will likely see the GBPUSD pair find support at 1.2585, with the pivot at 1.2640. A further slide could see a second support established at 1.2565. In the alternative, a pushback by the bulls at 1.2640 will target the 1.2665 resistance level, at which point the bearish view will be invalid. Further upward push by the bulls could see the resistance level move to 1.2685.

GBPUSD 30 minute chart


