- Summary:
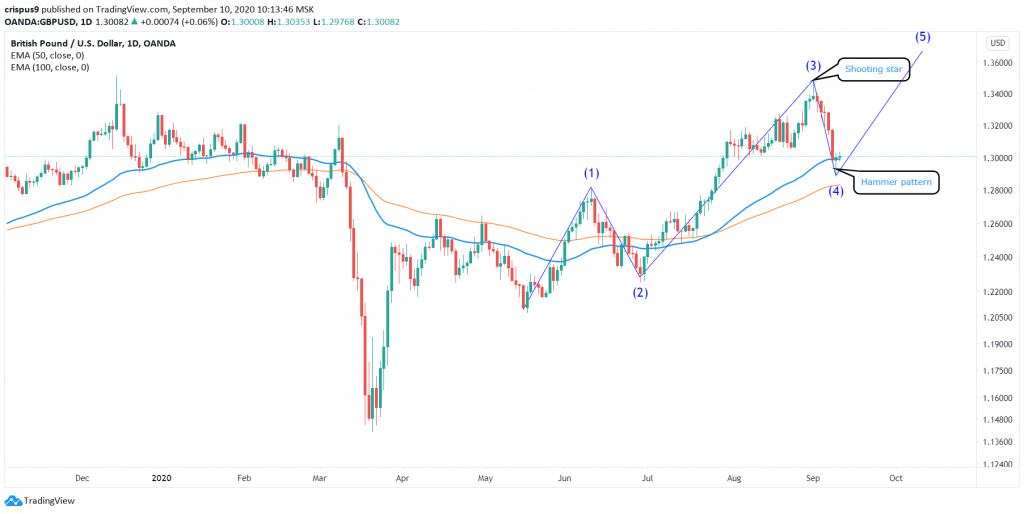
- The GBPUSD pair is bound to rise as evidenced by the hammer and Elliot wave pattern on the daily chart even as Brexit risks remain
The GBPUSD pair is up for the second straight day as traders remain concerned about the likelihood of a no-deal Brexit. The pair is trading at 1.3050, which is higher than the yesterday’s low of 1.2885.
The eighth round of Brexit negotiations is going on in London even as the likelihood of a no-deal Brexit continue to rise. Yesterday, the Boris Johnson government published a new bill that will break international law. The bill seeks to reverse the withdrawal agreement that Johnson signed with the European Union last year.
In a statement earlier today, Irish Prime Minister, Michael Martin, warned Johnson against going against what he signed. He pointed that doing that will breach the trust the EU has with the United Kingdom. He also warned that the decision will likely lead to the UK exiting the bloc without a deal. He said:
“Our colleagues in Europe, in particular those conducting the negotiations, are now wondering whether the will is there or not to arrive at a conclusion and get an agreement — and that is a very serious issue.”
In his part, Boris Johnson has said that the UK will do just fine without a deal. However, analysts and the government’s own statisticians warn that this will not be the case. A report by the UN has warned that the UK risked losing trade in goods worth more than £32 billion. That is mostly because the UK sells more than 45% of its goods to the European Union.
GBPUSD technical outlook
The daily chart below shows two main things. First, it shows that the pair formed a hammer pattern yesterday. This candlestick pattern is usually a sign of a reversal. Second, the chart shows that the price has just completed the fourth wave of Elliot wave pattern, which means that the price is likely to continue rising.
If this happens, therefore, there is a likelihood that the price will continue rising as bulls aim for the YTD high of 1.3466. However, if it moves below the yesterday’s low of 1.2885, it will invalidate this trend.
Do you want to be an excellent trader? Register for our free forex trading course and one-on-one coaching by traders with decades of experience in the industry.
GBPUSD technical chart


