- Summary:
- GBPUSD has been trading sideways for the last four sessions, but the dollar seems to have the upper hand as market waits for US CPI figures.
The British pound was down 0.18% against the dollar at 13:52 GMT on Monday, as the GBPUSD traded at 1.2609. The pair has traded sideways for the past three sessions, but a breakout seems imminent. Furthermore, the market currently has its focus on Tuesday’s release of the January US headline inflation figures.
In the meantime, the US dollar maintains the upper hand against six of the world’s leading currencies. The DXY index was at 104.22 at the time of writing, having gained +0.13% from the last session.
Four keynote statements will be coming out today, from Bank of England (BOE) Governor Andrew Bailey and FOMC members Neel Kashkari, Thomas Bakin and Michelle Bowman. Governor Bailey’s statement will particularly carry more weight, considering thanks to his position as head of the BOE’s monetary policy. The four statements will provide clues regarding the next interest rate decisions by two of the world’s most influential financial regulators.
The greatest impact, however, could come if the January US Consumer Price Index diverts significantly from the forecast 0.3% rise. A rise beyond that figure will create a strong case for the Fed to maintain high interest rates for longer, thus propping up the USD. However, a lower figure will support a dovish action by the Fed, thus strengthening GBP against the greenback.
Technical analysis
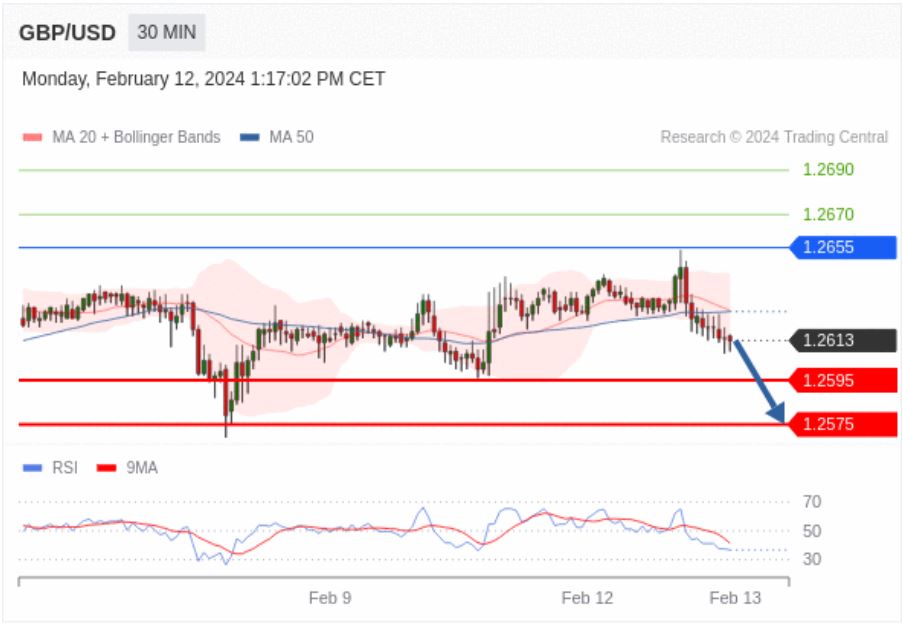
GBPUSD has found pivot at 1.2655, with the RSI favouring downside momentum. With the bears in control, we are likely to see the pair find the first support at 1.2595. Further bearish push beyond that level will likely see the pair head further down, with the next support coming at 1.2575. However, movement above the 1.2655 pivot could signal further gains with the first target at 1.2670. Furthermore, a break beyond that point will invalidate the bearish view and possibly push the pair to the next resistance at 1.2690.

GBPUSD 30 minute chart


