- Summary:
- Renewed fears surrounding a hard Brexit mount bearish pressure on the British Pound, which is on the verge of hitting new 2-year lows.
Fears that the UK would be forced to leave the EU in a no-deal situation resurfaced on Tuesday, and has sent the British Pound into a London session selloff that looks set to continue for the rest of the day.
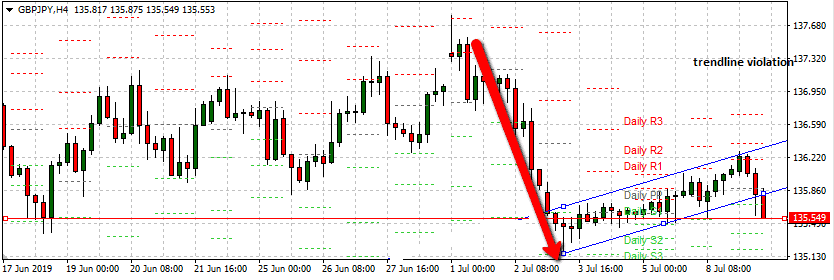
The hourly and 4-hour charts for the GBPJPY show the presence of a short term ascending channel which connects the highs and lows of July 2019’s trading sessions. However, the long-term charts show that this is a mere retracement within the context of a long term downtrend, and is actually the consolidation area of the bearish flag formation, whose pole extends from the highs of July 1 all the way to the lows of July 2. The bearish movement of Tuesday July 9 can therefore be confirmed to be the latest leg of movement that is expected to lead to the downward breakdown of the bearish flag, in continuation of the pre-existing downtrend.
The 4-hour chart below shows that the GBPJPY is well on the way to completing the 3% penetration breakdown move below the lower flag border, which will confirm the completion of the bearish flag and open the door for further depreciation of the currency pair.
GBP/JPY 4-hour Chart
It is possible that we may see a brief pullback to the broken flag border. This pullback may see price retesting the 135.90 to 136.20 price area, but this move is expected to be capped by renewed selling as the lower border of the flag acts in role reversal.
The breakdown move is expected to take the GBP/JPY all the way to the 133.50 price area, with support levels at 135.00 (psychological support), 134.50 and 134.00 also constituting possible pitstops.
Traders who intend to capitalize on the breakdown of the bearish flag of the GBP/JPY should look to sell a pullback rally at 136.00 – 136.20, with stop loss set above 136.30. Targets should be set at the same distance from the July 1 high to the July 2 low (i.e. the pole distance) with trailing stops set to follow the price movement at the previously identified short term support areas.
Don’t miss a beat! Follow us on Twitter.


