- The GBP/USD pair is down for the third day in a row as the gloomy economic situation in the UK weighs on the cable.
The GBP/USD has opened the week sharply lower, as the impact of the BoE’s negative outlook and the contraction of the UK economy weigh on the Pound this Monday. The pair is down 0.55% as of writing, marking a third straight day of losses.
On the back of the grim outlook for the UK economy painted by the Bank of England when it raised interest rates by 50 bps, Societe Generale has warned that the Pound could fall below the 1.20 mark soon as more room for bets against the Pound emerge. Olivier Korber, a strategist at the French investment bank, says the Pound is set to struggle against the dollar as the UK’s gloomy outlook contrasts with the more robust US economy.
A robust jobs report and cooling inflation have staved off fears of a recession in the US, giving the currency a more robust outlook versus the struggling Pound, which is also being hit by concerns over skyrocketing domestic energy prices.
GBP/USD Forecast
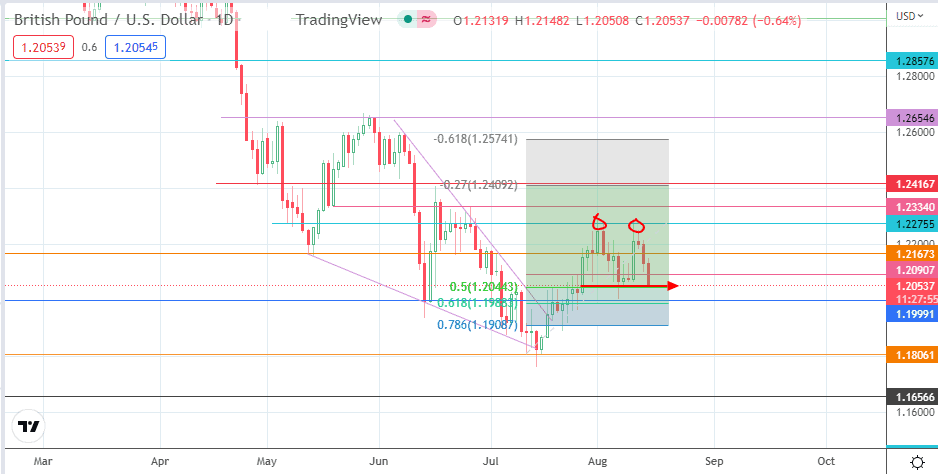
The daily chart shows that the recent price action is evolving into a double-top pattern. The active daily candle is now testing the neckline of this pattern at the 50% Fibonacci retracement from the 12 July swing low to the 2 August swing high (which forms the first peak).
A breakdown of this support at 1.20443 confirms the topping pattern and clears the way for a measured move that aims for completion at the 1.18061 support level (12 July low). The 78.6% Fibonacci retracement level at 1.19087 (12 July high and 21 July low) forms an intervening support between the first target and the completion point of the measured move.
On the flip side, a bounce off the 50% Fibonacci retracement move targets 1.20907 initially, before the 1.21673 resistance comes into the mix as a new upside target (5 August high). If the bulls uncap this barrier, 1.22755 (2 August high) becomes the next resistance target. Only when this top is broken can the recovery trend continue, pursuing additional northbound targets at 1.23340 (27 June high) and 1.24167 (28 April and 16 June highs).
GBP/USD: Daily Chart


