- The FTSE 100 Index printed red for the first time in seven days, with worries about June economic and wage data weighing down Q2 GDP figures.
The FTSE 100 index snapped its seven-session winning streak in Thursday’s European session as traders digested UK’s GDP and Business Investment market report. The index was down by 0.2 percent with 8,286 points at press time, with having eased from a high of 2,307 points. The 2,300 mark is turning out to be a potential resistance level, the FTSE having broken out to the downside at that mark about two weeks ago, and having been rejected around that level on Wednesday.
Is the UK economy sending mixed signals?
The UK’s GDP grew by 0.6 percent in the second quarter of 2024, and 0.9 percent year-over-year, matching analysts’ forecasts in each instance. However, The Business Investment fell below expectations during that quarter, contracting by -0.1 percent versus a forecast growth rate of 0.4 percent. Also, the economy did not experience any growth in June.
However, FTSE 100 will find support from the better-than-expected UK June Industrial Production figures, which showed a growth rate of 0.8 percent against a forecast figure of 0.1 percent. Also, Labour Productivity grew by 0.1 percent, surpassing the forecast contraction of -0.3 percent. That said, the Index also faces downward pressure from Wednesday’s wage growth figures, which showed that the cost of labour remained high in July, thus minimizing hopes of interest rate cut in September.

FTSE 100’s top gainers at the time of writing included Admiral Group (+8 percent), Unilever (+0.4 percent), BAT (0.3 percent) and AstraZeneca (+0.9 percent), whose valuation crossed the £ 200 billion on Wednesday. Notable losers included Rio Tinto (-3 percent), Shell (-0.6 percent), HSBC (-0.6 percent), Rolls Royce (-0.5 percent), and GlaxoSmithKline (-0.2 percent).
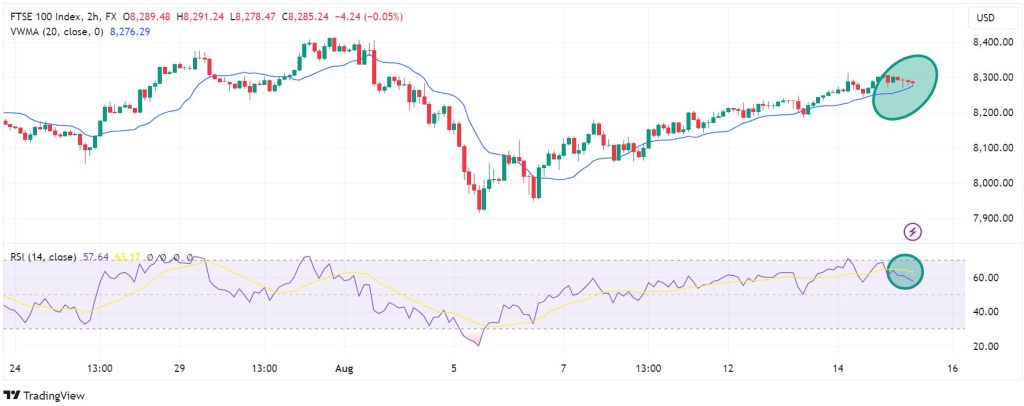
Momentum indicators
The 2H chart below shows that the FTSE 100 Index has lost upward momentum, with the sellers taking charge. The Index is about to cross below the Volume Weighted Moving Average (VWMA), which currently corresponds to 8,276 points. Also, the RSI is at 58, but the indicator line has crossed below the RSI-based MA, signaling a bearish undercurrent.
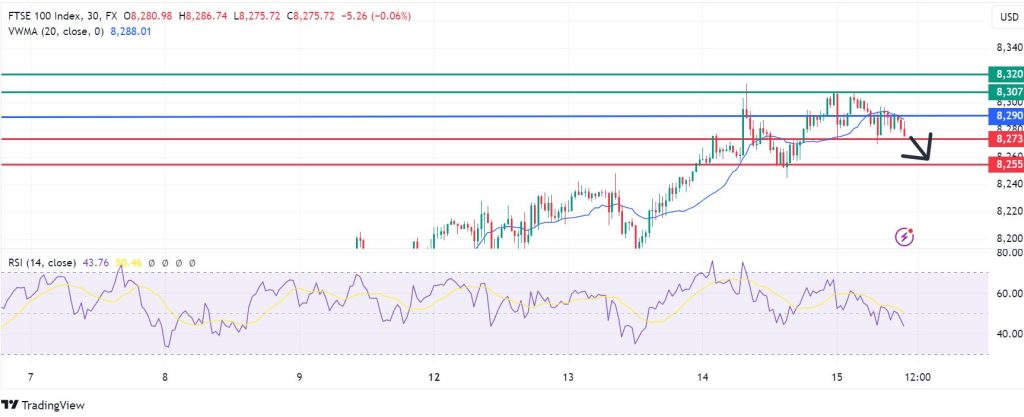
FTSE 100 support and resistance levels
On the 30-minute chart, the Index looks set to continue the downside if resistance persists at 8,290 points pivot mark. With that in mind, look for the first support around 8,273. However, rising selling pressure at that point could breach that mark and build the momentum to test 8,255. Conversely, a move above 8,290 will signal control by the bulls. That could lead the Index to encounter the first resistance at 8,307. Nonetheless, a stronger upside momentum will break above that resistance and invalidate the downside narrative. Furthermore, it could lead to further gains to test 8,320.