- Summary:
- The FTSE 100 index could be in for a further slide as the bearish engulfing candlestick pattern plays out on the daily chart.
Despite cooling inflation, the FTSE 100 index has fallen steeply for the second day in a row. The selloff comes as rate hike fears continue to overshadow any sentiment around the fall in UK inflation. This morning, data from the Office of National Statistics indicated an annualized rise in UK Consumer Price Index of 9.9%, representing a two-percentage-point drop from the previous month’s data. The consensus had been for a drop from 10.1% to 10.0%.
The fall in consumer prices came as falling oil prices led to a cooling in fuel prices. Commodity stocks took a hit on the FTSE 100, as oil prices fell 0.55% this Wednesday. The two-day dip in prices on the Brent crude benchmark come as the International Energy Agency (IEA) predict a drop on demand for crude oil in the 4th quarter of 2022. However, the US Consumer Price Index is back on the uptrend, and this is sparking fears of renewed rate hikes with an attendant spread of the market concerns.
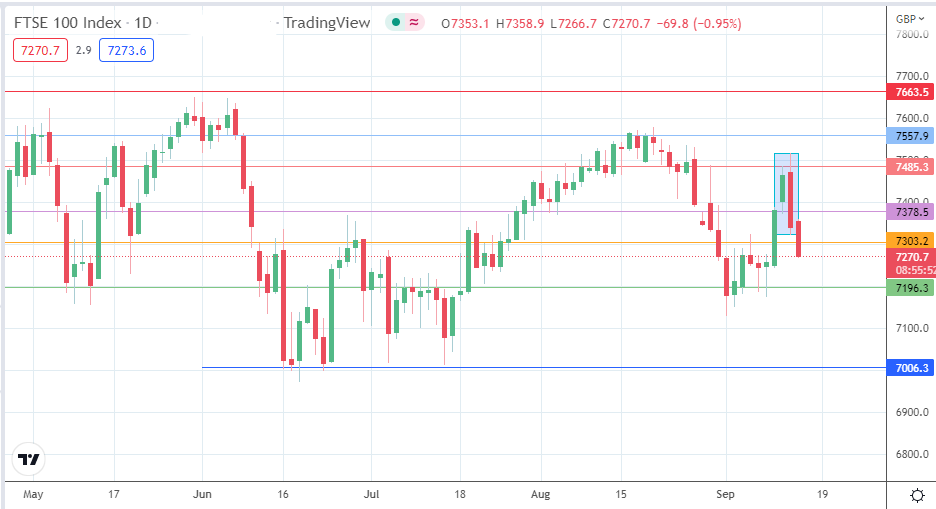
From a technical analysis standpoint, Tuesday’s dip from the 7485 resistance formed a bearish engulfing candle. This pattern points to a further selloff, seen this Wednesday, along with a downside violation of the 7303 support. What is the outlook for FTSE 100 based on this price picture?
FTSE 100 Index Outlook
The bears must force a 3% penetration close below 7303 to convert the violation into a breakdown move. This would clear the pathway toward 7196 (21 June high and 7 September low). If the selloff extends below this point, the 7100 psychological price mark (11 July low) becomes the new downside target. The 16 June low at 7006 is an additional harvest point for the bears if the bulls fail to defend the 7100 psychological price point.
On the other hand, the bulls need to defend the 7303 support by preventing a 3% downside penetration close. A close above 7303 makes way for a march toward 7378 (29 August high and 12 September high). 7485 (22 March and 30 August highs) and 7557 (9 June and 18 August highs) are additional harvest points for the bulls if the advance clears the 7378 resistance.
FTSE 100: Daily Chart


