- Summary:
- FTSE 100 started the session higher as traders digest the latest employment data. The UK ILO Unemployment Rate rises to 4.1% in July
FTSE 100 started the session higher as traders digest the latest employment data. The UK ILO Unemployment Rate rises to 4.1% in July in line with expectations. The June reading was at 3.9%. The number of people on companies payrolls fell by 695,000 between March and August.
The number of job vacancies increase to 434K in the three months to August, 30% higher than the previous three months but still is well below the pre-coronavirus levels. The fall in the number of people in employment was 12,000 below the expectations of a drop of 125,000.
More than 5 million workers were away from work in July with almost 2.5 million being away for three months or more. A clear drop in unemployment with a record drop of 146K came from young people between 18 to 24. Analysts expect that more jobs will be lost when the job subsidies would expire at the end of October.
Ocado Rallies 5.82%
Ocado Group is the top performer today after the company announced a sharp rise in revenue in the 3Q, which boosted by higher average spends. Now the company expects annual core earnings of £40 million. The revenue in the 13 weeks to August 30 rose by 52% to £587 million while the average weekly orders jumped by 9.6% to 345,000.
FTSE 100 Technical Analysis Levels to Watch
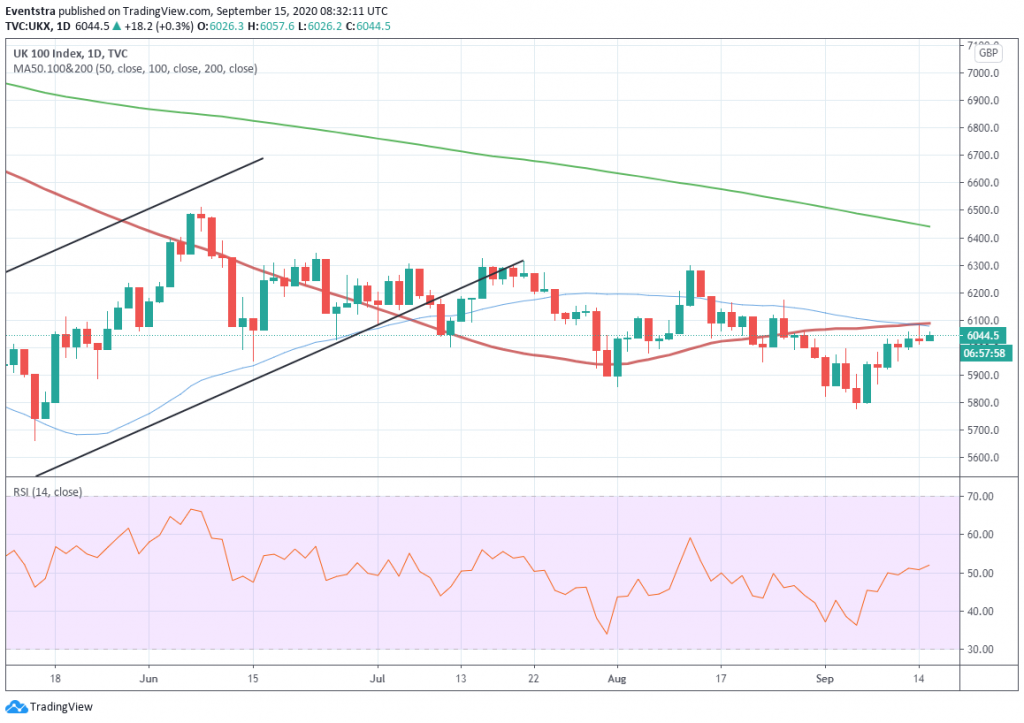
FTSE 100 is 0.22% higher at 6,039 in cautious trading as the index is approaching the strong resistance at 6,088. Intraday support for the FTSE index would be met at 6,000 area the ow from today and yesterday session. Next target for bears is at 5,951 the low from September 10. In case of a break lower the next support area is at 5,781 the low from September 4.
On the other side, as I mentioned above the critical resistance for the short term trend is the 100-day moving average at 6,088. More selling pressure would be met at 6,173 the top from August 25. Above 6,173, the next resistance stands at 6,301 the high from August 12.
FTSE 100 Daily Chart


