

- The EUR/CHF is set to head lower as the hotter-than-expected US PPI data points towards tariff-induced inflation & reinforces risk-off mood.
So here we have it: a red-hot US Producer Price Index report for January 2026. Core PPI came in at 0.8%, higher than the projected 0.3% and also much hotter than the prior 0.6%, which was revised lower. Headline PPI came in at 0.5%, again beating the consensus and prior numbers of 0.3% and 0.4%, respectively.
What does this mean for EUR/CHF predictions heading into the month of March 2026?
EUR/CHF Prediction Today: What’s Driving It?
Even before the US data release, the pair had already been facing headwinds after Swiss National Bank Chairman Martin Schlegel indicated that local inflation could temporarily head into negative territory, even though the SNB still expected inflation to rise gradually. The low inflation compared to the Eurozone makes the Franc more attractive and limits any pressure for an anti-Franc market response.

The US PPI was released against the backdrop of ongoing trade tensions stemming from the recent 15% global tariffs on all US imports from every country. The situation had placed the market in a risk-off mood for most of the week. The red-hot US PPI data now firmly feed a narrative of tariff-induced global risks for widespread inflation, which is a risk-averse scenario.
As such, with investors now pouring into safe-haven assets, the Swiss Franc remains firmer against its peers, putting the EUR/CHF under pressure. The Franc has historically been structured to benefit from Switzerland’s low inflation and safe-haven status. Consequently, the EUR/CHF is poised to close the week sharply lower, reflecting safe-haven demand for the Franc.
EURCHF Prediction: Technical Outlook
The weekly chart shows the price has breached the floor of the descending triangle at 0.9192, confirming the bearish continuation. This lines up downside targets at 0.8910 and 0.8478, with the latter being the 61.8% Fibonacci extension and completion point of the pattern’s measured move.
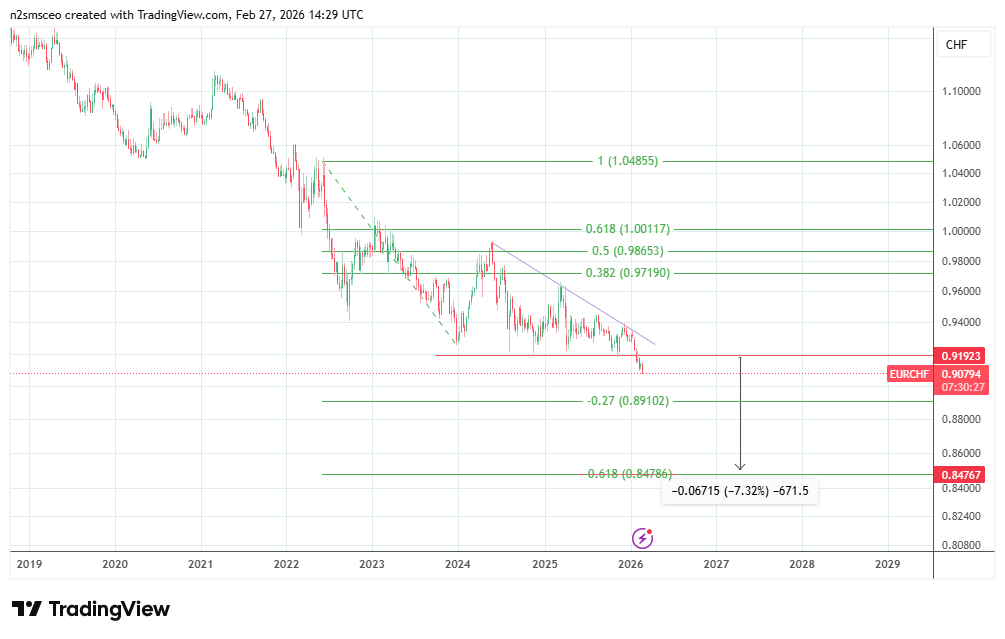
Any recovery above the resistance at 0.9400 could allow for a further uptick towards 0.9719 or 0.9865, the 50% Fibonacci retracement level of the 13 June 2023 – 1 January 2024 downswing. However, as long as the price stays below 0.9400, any upticks in price are potential rally-sell points.