
- EUR/INR has recently broken below 107.00, indicating the rupee's resilience despite high crude oil prices
- Interventions by Reserve Bank of India (RBI) have helped keep the rupee steady
- Interest rate differentials between the RBI and the European Central Bank (ECB) as well as upcoming ECB minutes are the near-term primary focus
EUR/INR forex pair has moved mostly sideways in the last two weeks, leaving investors wondering whether a breakout is due. The pair hit its highest point of 110.17 on January 28, 2026, and since then it has dropped sharply. The pair, which spent most of the early year going up, has recently hit a ceiling and is having trouble getting back to the 107.00 handle after reaching highs of 107.91.
Why Is the Rupee Gaining Ground?
The rupee is getting stronger because the RBI is stepping in, oil prices are falling, and trade relations are improving. The US-India trade deal, reducing tariffs to 18% from 50%, has generally boosted sentiment around the rupee.
The consensus view entering 2026 was decisively euro-bullish for the EUR/INR cross. The interest rate differential is helping the INR in a way that most people don’t realize. The European Central Bank’s (ECB) deposit rate is at 2.00%, while the target for the RBI repo rate is 5.25% through December. This difference of over 300 basis points keeps the demand for the rupee high, even as the RBI loosens its policies.
Furthermore, looser regulations on foreign investments have enabled more capital to flow faster into India. With limits lifted to $1 billion and longer payback times allowed, the Indian central bank quietly encourages more debts in euros. This favours the rupee to strengthen further.
Will EUR/INR Decline Extend?
A further extension of the EUR/INR decline is possible in the near term if RBI continues its supportive stance and Eurozone data remains soft. However, the pair’s sideways trading below 107.00 suggests consolidation rather than a decisive breakdown.
The decline could continue if the RBI keeps intervening and oil prices stay low. Projections suggest a range of 122-129 for 2026, averaging 124-126, with March at 123.24. A longer-term view projects 114-125, with early estimates at 118-121.

Changes in trade relations between the US and India, for example, could have an indirect effect on flows. It will be very important for traders to keep an eye on the RBI’s intervention levels and the ECB’s minutes.
EUR/INR Forecast
EUR/INR RSI has dropped below the neutral zone to 42, indicating a strong directional bias towards the downside. The immediate floor is at the 105.70 mark, which aligns with the bottom of the recent two-week range. Below that, the psychological level at 105.00 serves as the major structural support. Primary resistance is anchored at the Volume Weighted Moving Average (VWMA) at 107.08, followed by 107.91.
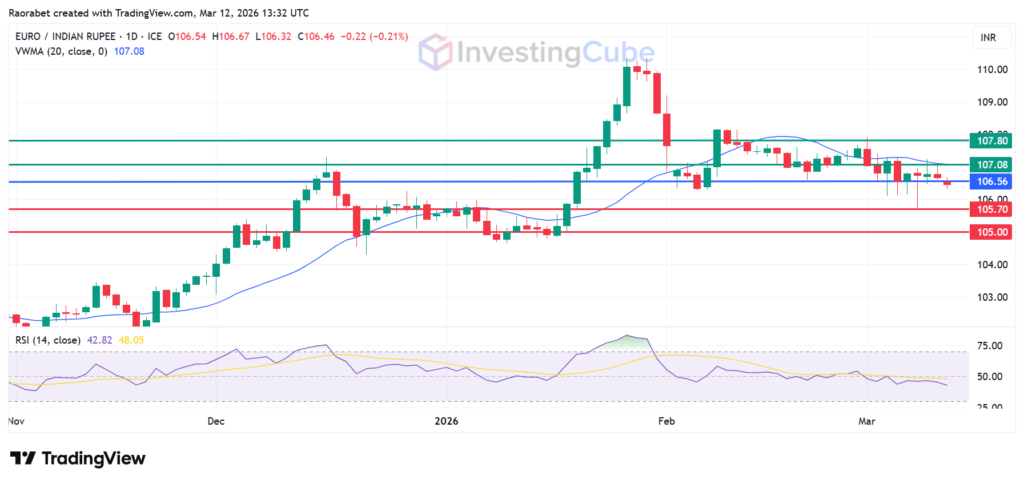
EUR/INR FX pair with key support and resistance levels on the daily chart on March 12,2026. Created on TradingView
Consolidation reflects balanced forces of RBI support and Eurozone data, preventing decisive moves. Recent rejection at 107.00 highlights technical resistance amid uncertainty.
While the Rupee is strong, the ECB’s refusal to cut rates while keeping the deposit rate at 2.15% creates an interest rate differential that historically supports the Euro.
While both regions import energy, the Eurozone is more sensitive to natural gas disruptions. If Middle East tensions lead to a sustained energy shock, the Euro could see further risk-off selling against a relatively more isolated Indian economy.
