- Summary:
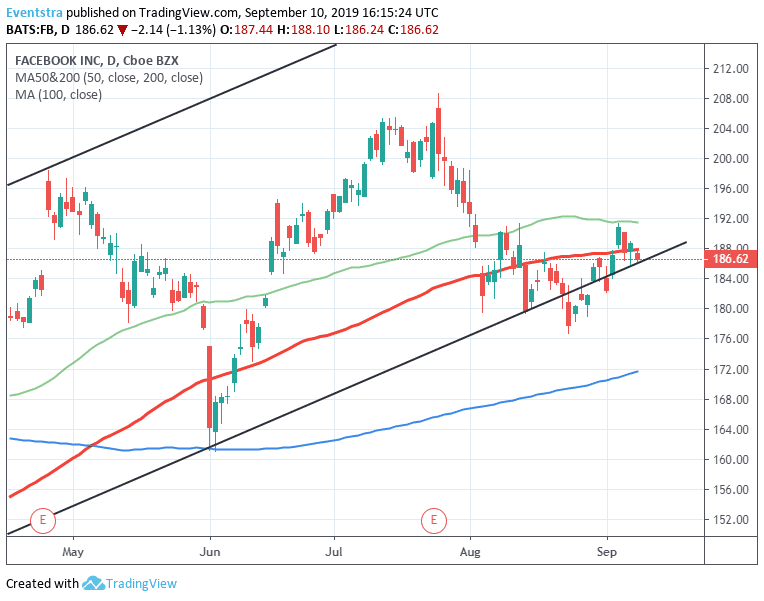
- Facebook (FB) stock price today failed to hold above the 100-day moving average at 187.92 and as of writing the stock price is 1.05% lower at 186.87
Facebook (FB) stock price today failed to hold above the 100-day moving average at 187.92 and as of writing the stock price is 1.05% lower at 186.87. Facebook stock price finds support at 186.25 where the ascending trendline from December 2018 crosses. The stock price started a correction after the rejection at 191.61 the 200-day moving average. If the stock price breaks below the ascending trendline sellers will step in and a move down to 176.86 low from August 23rd looks possible. On the upside, first resistance stands at 188.10 today’s high while more offers will emerge at 191.47 the 200-day moving average. The long term technical outlook is positive for Facebook, while the short term is neutral.
On the fundamental side, Facebook 2Q results showed that the company had a strong quarter and the business and community continue to grow. Facebook reported Q2 revenue that beat analyst’s expectations. Revenue came in at $16.89 billion, a 28% increase year-on-year versus $16.49 billion expected. Earnings Per Share (EPS) came in at $0.91 versus $1.74 expected.
Facebook metrics increased in second-quarter; the DAUs were 1.59 billion on average for June 2019, an increase of 8% year-over-year. MAUs were 2.41 billion as of June 30, 2019, an increase of 8% year-over-year.
Mobile advertising revenue was approximately 94% of advertising revenue for Q2 of 2019, up from approximately 91% of advertising revenue in the second quarter of 2018.
The company now estimates that more than 2.1 billion people now use Facebook, Instagram, WhatsApp, or Messenger every day, and more than 2.7 billion people use at least one of facebooks group of services each month.


