- Summary:
- The EURUSD recovered some upside momentum on Monday, but PMI figures from the US and the Eurozone will likely push a breakout to Thursday.
The EURUSD flattened in the New York session on Wednesday on mixed fundamentals from the Eurozone and the US. The pair was at 1.0859 at the time of writing, with the euro under pressure despite the European Central Bank keeping interest unchanged last week. The bank is expected to announce at least two interest rate cuts, for the remainder of the year, with the first one poised to come in September. That will likely keep the euro subdued, even as the dollar also faces pressure from high odds of a rate cut in September.
EURUSD also faces pressure after the preliminary July Eurozone PMI came in at 45.6, against the consensus market forecast of 46.0. Similarly, the Services PMI was below the forecast figure, with the reading standing at 51.9 versus 52.9. The misses were headlined by lower-than-expected PMI figures from the Eurozone’s top two economies, Germany and France. Germany’s Manufacturing and Services PMIs fell below analysts’ forecasts. On the other hand, France’s Services PMI exceeded the forecast, while the Manufacturing PMI fell short.
Meanwhile, the dollar is boosted by a higher-than-expected S&P Global Services PMI, which came in at 56.0, exceeding the forecast figure of 54.7. However, the upside will be limited after the US manufacturing activity contracted in July. The S&P Global Manufacturing PMI which read 49.5 from June’s 51.6, and below the forecast figure of 51.7. Also, US New Home Sales figures dropped to 617k in June, from May’s 621k, falling short of the 629k forecast.
The EURUSD pair will also get fresh volatility on Thursday when the US second quarter GDP figures come out, and traders are likely to reposition themselves for the release later on Wednesday.
Momentum indicators
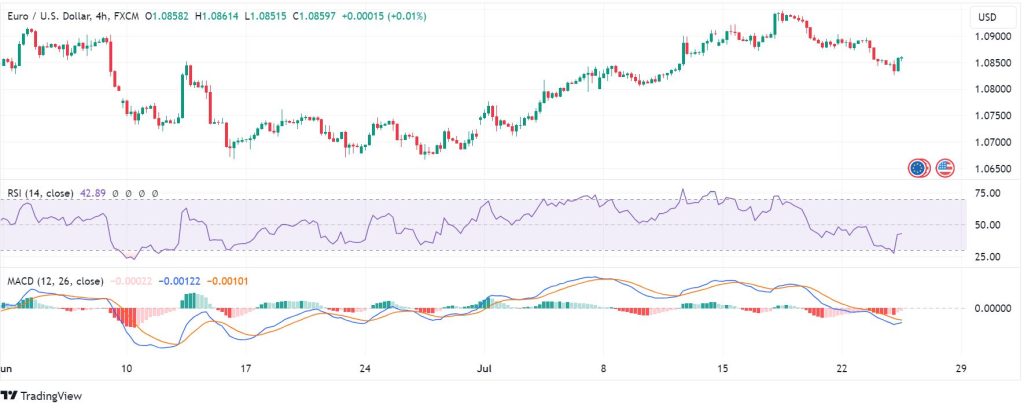
On the daily price chart, the RSI indicator is at 54, suggesting that the EURUSD pair has a stronger buying momentum than the selling momentum. However, the RSI on the 4-hour chart is at 42, signaling that the momentum has recently turned in favour of the sellers. Similarly, the MACD indicator favours the downside narrative, with the indicator line below the signal line.

Support and resistance levels
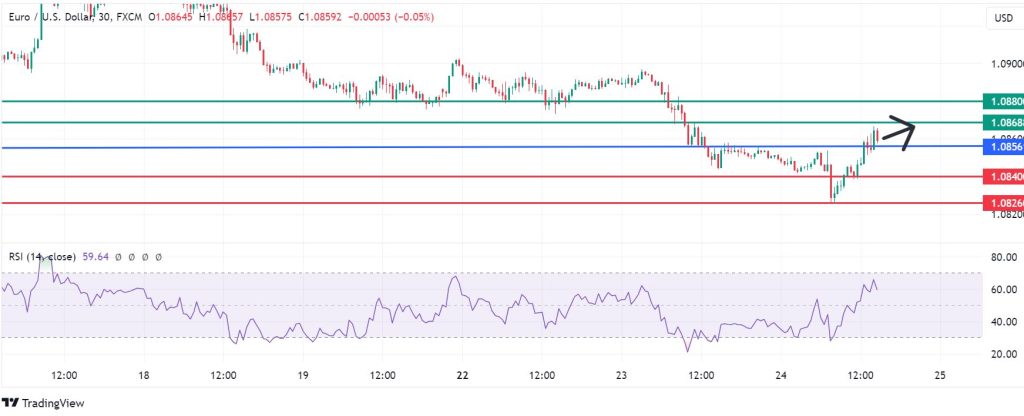
EURUSD sellers will be in control if resistance persists at the 1.0856 pivot. That could lead to the establishment of the first support at 1.0840, below which the next support will likely be at 1.0826. Conversely, a move above 1.0856 will favour the buyers to take control. However, the upside movement will likely encounter the first resistance at 1.0868. Extended control by the buyers at that point will likely break above that mark and invalidate the downside narrative. Furthermore, it could lead to more gains to take the pair higher to test 1.0880.

| Pivot | Last Price |
| 1.0856 | 1.0859 |
| Resistance Levels | Support Levels |
| R1:1.0868 | S1: 1.0840 |
| R2:1.0880 | S2 : 1.0826 |


