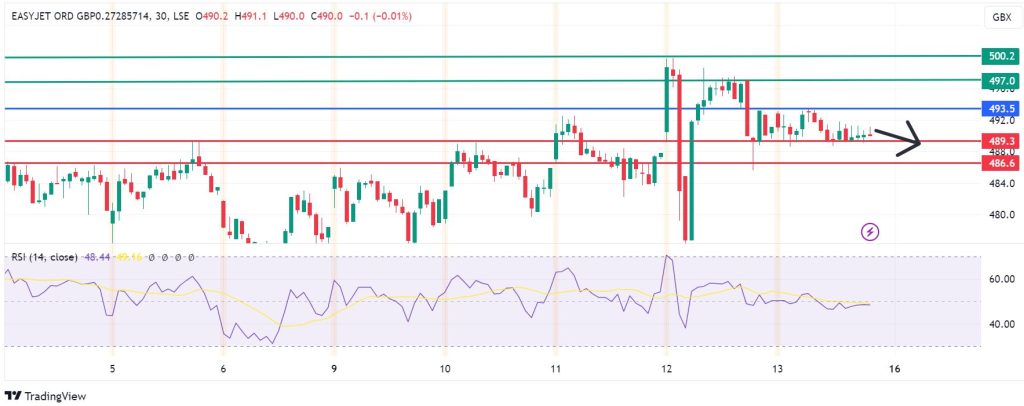
- easyJet share price currently trades above the 20,50 and 100 Simple Moving Average (SMA) levels, and its outlook remains positive this year.
easyJet share price snapped a three-day winning streak, trading at GBX 490.2 after going down by 0.2 percent. The budget airline company is still riding on the positive sentiment built following a 16 percent jump in profits for the quarter ended June 30. In addition, its outlook for the EasyJet Holiday arm is positive, with returns for the one year period ending September 2024 expected to rise to £180 milion from £122 million a year ago.
Positive outlook for easyJet
The airline company’s air ticket sales rose by 1.5 million last quarter, and it expects that figure to rise following a strong travel trend this summer. Its package traveling division, EasyJet Holiday, has been a success this year, inspiring rival airline Ryanair to announce that it will be launching a similar business segment.
On Tuesday, EasyJet Holidays reported that it had seen a spike in demand for holiday destination packages for areas not traditionally known to be popular tourist destinations. They include areas in Greece, Egypt and Morocco that could provide new revenue inflows.
Meanwhile, JP Morgan analyst Harry Gowers maintained a “buy” rating on easyJet (LON: EZJ) share price, with a target of GBX 660. That paints a positive outlook for the stock, as it means there could be a headroom as high as 34 percent from the current price. As of this writing, the stock trades above the 20,50 and 200 SMAs, but below the 200-SMA of GBX 500.2. That said, it is about -3 percent year-to-date.
easyJet Share price today
easyJet share price looks likely to continue heading downward if resistance persists at the 493.5 mark. That will likely see the first support established at 489.3. However, extended bearishness could catalyse a breach of that support to test 486.6.
Conversely, a move above 493.5 will tilt the scales to favour the buyers, with first resistance established at 497.0. However, further bullishness at that level could break above that mark to invalidate the downside view and test 500.2


