- Summary:
- The EasyJet share price could be in for a continuation of the downtrend if the pattern on the daily chart plays out as expected.
The EasyJet share price is marginally higher this Monday but is trading on very-low volumes as the bulls struggle to carry the momentum of the price action forward. This uptick has enabled the EasyJet share price to recover some losses sustained in Friday’s 1.48% drop.
The EasyJet share price is facing headwinds from a proposed 9-day strike by a section of its pilots. The Spanish-based pilots want better working conditions and a reinstatement of the pre-pandemic conditions of service.
Airline unions, like several other UK labour unions, seek higher pay to compensate for the skyrocketing living costs as inflation bites harder across the globe. Due to staff shortages, airlines are already struggling to cope with a surge in passenger demand this holiday season.
This is not the first time staff of the budget airline have walked out of their jobs in 2022. There have been two strikes in July by cabin crew members. A third strike by the cabin crew of its Spanish operations was only prevented by a last-ditch deal which featured an improved salary offer. This deal may have motivated the pilots to make their demands.
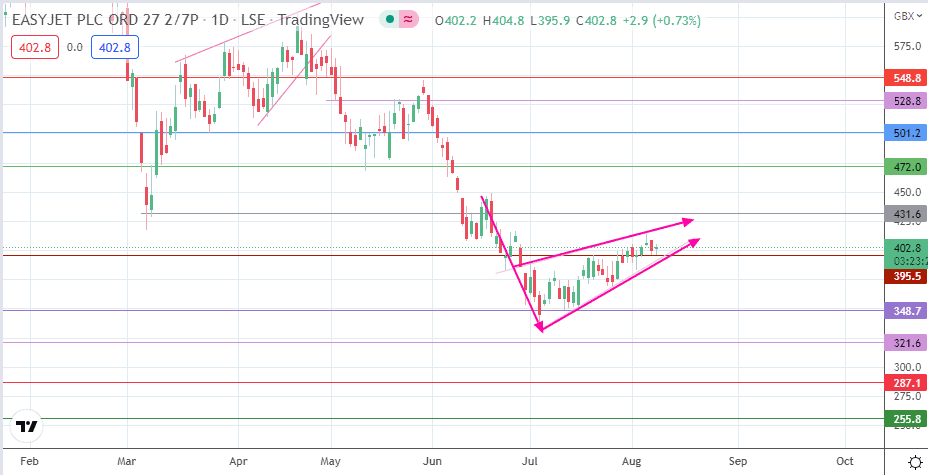
A technical analysis of the daily chart shows that the EasyJet share price action is starting to contract into a bearish pennant pattern, indicating that the recovery move from the 15 July low may be losing momentum.
EasyJet Share Price Forecast
The emerging bearish pennant pattern on the daily chart points to a resumption of the downtrend if the bears can degrade the lower border to complete the pattern. This scenario would throw up targets at 348.7 (29 November 2010 and 16 March 2020 lows) and 321.6 (former neckline of inverse head and shoulders pattern of April to December 2011). A further decline targets 287.1 (7 December 2009 and 23 August 2010 lows), leaving 255.8 (24 April 2006 and 12 September 2011 lows).
On the flip side, a bounce on the 395.5 support (27 June and 3 August lows) that breaks the 431.6 resistance (15 June 2022 high) invalidates the pattern and enables the bulls to push toward 472.0 (12 May 2022 low). A further advance brings 501.2 into the mix (24 March 2022 and 17 May 2022 lows) before 528.8 (20 May 2022 high) becomes an additional target to the north.
EasyJet Daily Chart


