- Summary:
- The Dow Jones Index returned to the upside on Thursday after the second quarter US GDP data returned confidence to the market.
The Dow Jones Index snapped its downturn on Thursday on news of better-than-expected US GDP reading. The Index was up by 0.3 percent to register 39,972 points. The gains saw the index recover some of the losses that had put in on course to registering the largest weekly loss in seven weeks. The market had been on a downturn despite rising investor confidence about the chances of a Fed interest rate cut before September.
What’s moving the Dow Jones Index?
US GDP grew by 2.8 percent in the second quarter of the year, double the rate in the first quarter, and exceeding analysts’ forecast figure of 2.0 percent. However, that, too is a double-edged sword for the markets. While it boosts confidence around the investment environment, it also eases the pressure on the Fed to announce rate cuts before September. That could bring downward pressure on equities in the coming weeks. Furthermore, Durable Goods Orders fell by 6.6 percent in June, tainting the bullish view of the economy in the third half of the year.
Most leading Dow Jones equities had been on a downturn, headlined by underperformance in the tech sector. Microsoft Stock price has printed a red candlestick for the last two weeks and is down by 3.6 percent as of this writing. Apple was down by 3.7 percent this week, having declined by a similar margin last week. Home Depot was also on a five-session losing streak before today’s news spiked the stoke price by 1 percent at press time. However, the Dow’s largest stock by weight, UnitedHealth has had a good run, up by 0.5 percent on the weekly chart and by 1.5 percent today. Goldman Sachs was also up by 0.8 percent this week and had gained 0.4 percent in intraday trading as of this writing.
Momentum indicators
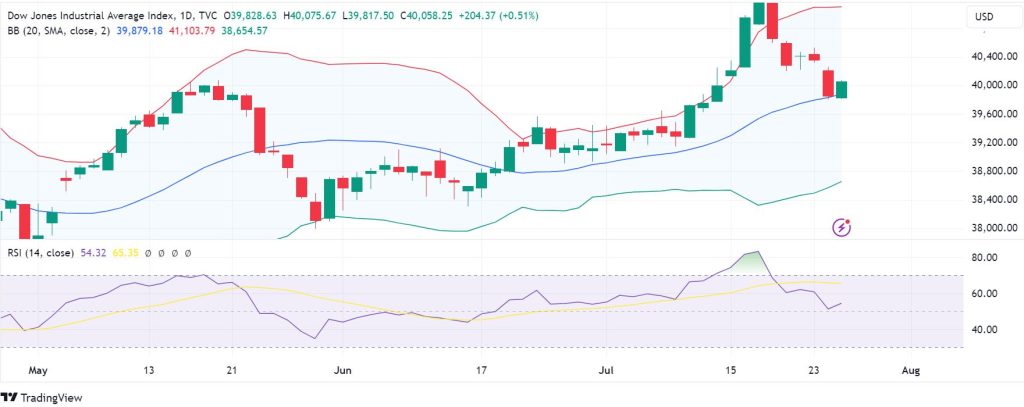
On the chart below, a green candlestick has just interrupted a downtrend of red candlesticks on the 1-day Dow Jones Index Bollinger Band at the middle line intersection. This signals a shift to control by the buyers, and an impending reversal to the upside. Also, the RSI is at 54, which is supportive of a continuation of the upside.
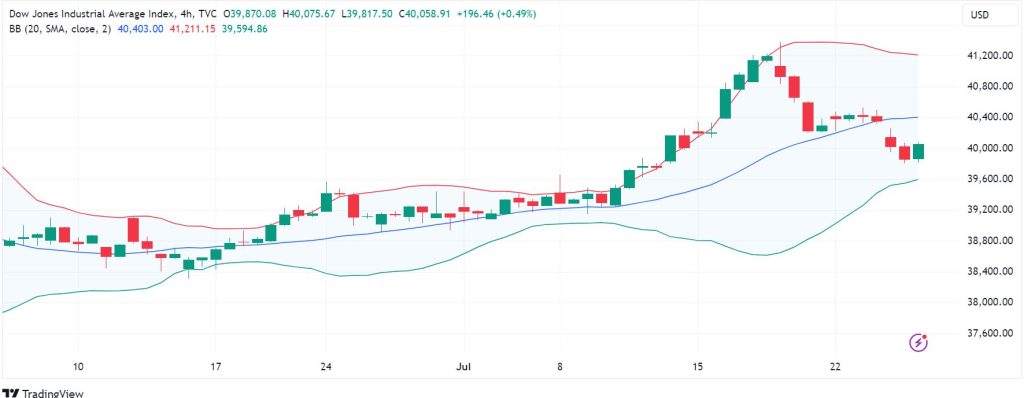
Also, on the 4-hour chart, a green candlestick has just stopped the move towards the lower Bollinger Band, showing a strengthening upward momentum.
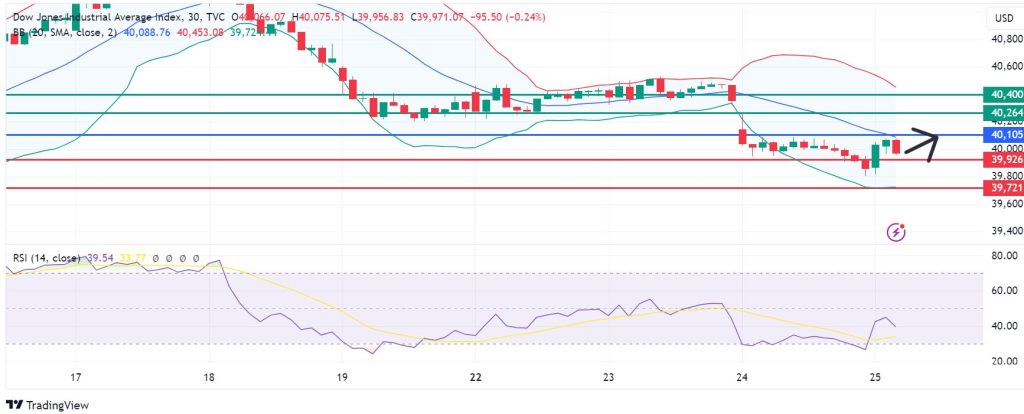
Resistance and support
The momentum on the Dow Jones Index signals control by the bulls above 40,105. That could see the establishment of the first barrier at 40,264, with further gains possibly breaching that mark to send the index higher to test 40,400. Conversely, a move below 40,105 will signal control by the sellers. In that case, the first support could come at 39,926. However, extended control by the buyers could breach that mark, thereby invalidating the upside view and potentially testing 39,721.