- Dow Jones Index Forecast: Dow futures are down 167 points as the FOMC minutes confirm more rate hikes later this year.
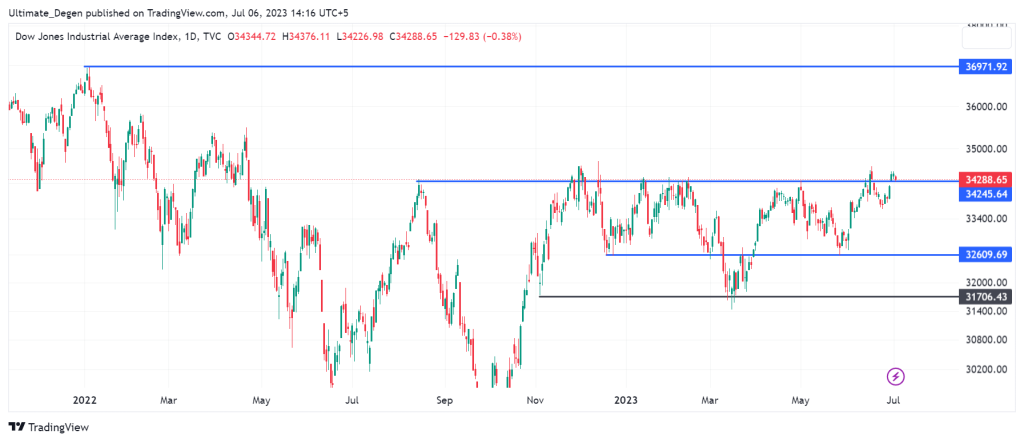
Dow Jones Index (INDEXDJX: .DJI) is once again retesting a major resistance level on its chart. While the index has surged 19.4% since October, it has still underperformed other indices like Nasdaq 100 and S&P 500. Dow Jones Industrial Average needs to gain strength above the 34,200 level soon, or the bears may strike soon.
After a 2.02% rise last week, Dow futures are down 0.35% this week. A slight bullishness in the markets turned the index green on Monday, but the gains were lost on Wednesday as the FOMC minutes came out. The S&P 500 index also slid by 0.20%.
Why Is Dow Underperforming NASDAQ 100 & S&P 500
Dow Jones Index consists of the higher capped companies. The stocks of these giants take much more capital than the stocks with low market capitalizations. Unlike NASDAQ 100 index, Dow Jones Industrial Average consists of a diverse set of companies. Many of these companies have not surged like tech stock in 2023.
The high interest rates in the US have significantly reduced the liquidity in the markets. In the recently released FOMC minutes, the members have vowed to hike rates further this year. However, the pace of upcoming rate hikes may be slower than earlier.
Dow Jones Index Needs To Break 34,200 Level ASAP
As mentioned in my previous DJI forecasts, the 34,200 level is the most critical resistance on the chart. A reclaim of this level may send the benchmark index above the 35,000 level, where lies the next major resistance. The index has already faced multiple rejections from 34,200.
Therefore, Dow Jones Index forecast is dependent on the outcome of the ongoing retest. Another rejection from 34,200 may be very brutal and tank the index to its 32,600 support level which is visible on the following chart.
I’ll keep posting my updated DJI analysis and my personal trade setups on Twitter, where you are welcome to follow me.


