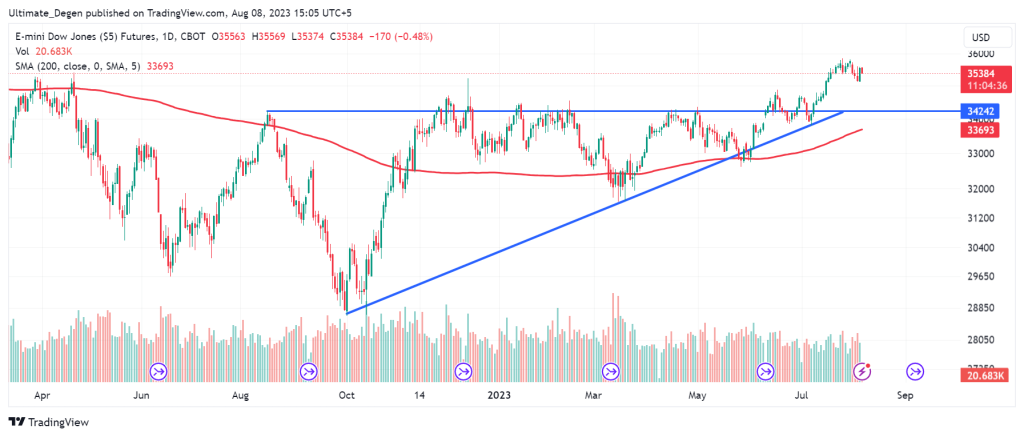
- Dow Jones Index Forecast: After a strong rebound on Monday, Dow futures slid 0.48% on Tuesday due to weak Chinese economic data.
Dow Jones (INDEXDJX: DJI) Index had a strong rebound on Monday after a 0.43% pullback on Friday. The index is still looking bullish as the traders await the release of the July CPI report. The upcoming inflation data will help figure out the next move of the US Fed.
Dow futures are having a pullback on Tuesday during the Asian session. At press time, the future contracts for the Dow Jones Industrial Average were changing hands at 35,390 points after a 0.48% correction. However, on a higher timeframe, the outlook remains bullish.
DJI Corrects As Crude Oil Tanks
On Tuesday, the Chinese economic data showed a more-than-expected drop in the country’s imports and exports during July 2023. The news triggered a pullback in Asian equities and crude oil. The correction in oil prices led to a pullback in energy stocks.
Dow Jones Index may open lower today due to the reasons mentioned above. Another reason behind the down-trending Dow futures is the increase in the DXY index. The dollar strength index is gaining strength above 102 points level, which is causing headwinds for equities and commodities.
Dow Jones Index Forecast After CPI Report
The CPI report for July 2023 is set to be released on August 10. The report will show the increase or decrease in inflation on a YoY and MoM basis. A decrease in inflation might result in a pause in rate hikes which will be bullish for US stocks.
Dow Jones Index forecast is looking bullish amid weak job data and a decreasing inflation. However, after a 7-month-long rally, many analysts are expecting at least a short-term pullback in the stock market. If such a pullback occurs, 34,250 will be the key level to watch on DJI chart.
I’ll keep posting my updated DJI analysis and my personal trade setups on Twitter, where you are welcome to follow me.


