The Dow Jones Industrial Average continued from where it left last week, extending its gains by 0.5 percent at the opening of the markets on Monday to hit new record high 41,432.61 points. The Index is riding on the upbeat momentum following Federal Reserve Chairman Jerome Powell’s speech at the Jackson Hole symposium on Friday where he stated that time had come for the central bank to readjust its monetary policy.
Powell’s comments were taken as an affirmation of a rate cut in September, strengthening the view that a recession could be avoided. For the Dow Jones Index (INDEXDJX: .DJI), this week comes with high stakes, with long-term stock market bellwether, Nvidia, set to release its earnings report on Wednesday.
Nvidia share price set the tone for the rest of the stock markets in the US for the better part of the first half of the year, and its earnings could either provide further propulsion or inject caution. The AI chips market leader is not in the Dow (although it checks all the boxes), but its headline-grabbing exploits from 2023 have established it as a market barometer.
Down the line, the Fed’s preferred inflation gauge, the Personal Consumption Expenditure (PCE) figures will be out on Friday, and will provide useful hints as to the extent the Fed’s imminent rate cuts.

Meanwhile, the Dow’s third-largest component stock, Microsoft, was down by 0.3 percent, the only stock in the negative territory among the Dow’s top 10 largest stocks at the time of writing. American Express (+1.8), Caterpillar Inc(+1.1 percent) and Visa Inc Class A (+0.9 percent) led the early gainers.
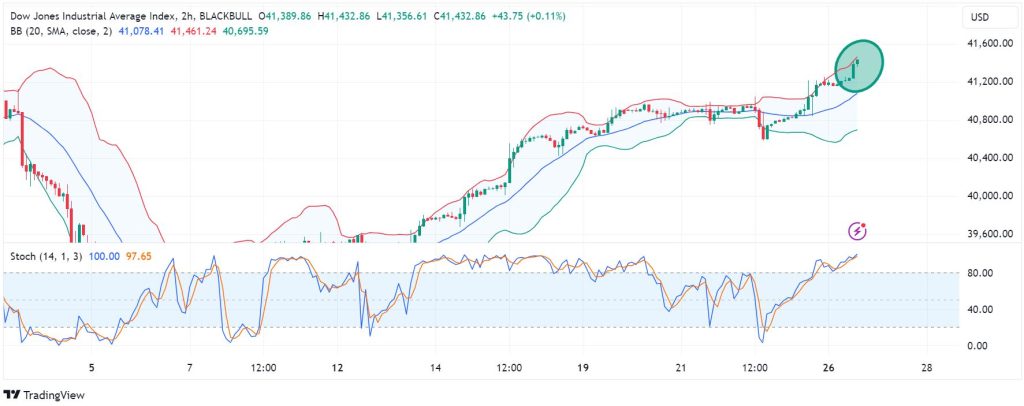
Momentum indicators
On the 2-hour chart, the Dow Jones Index is attempting to intersect with the upper Bollinger Band, showing strong bullish control. This view is further supported by the Stochastic oscillator, whose reading at 96 is deep inside the overbought territory, but signalling a bullish control nonetheless.
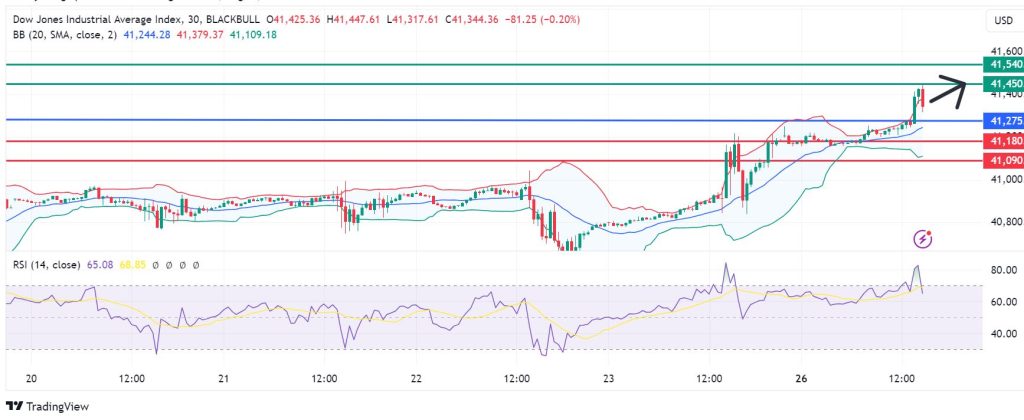
Support and resistance
The chart below signals control by the buyers above the 41,275 points mark. If the momentum remains in play, we could see the next resistance at 41,450. However, if the bulls extend their control of the markets, they could clear that level and test 41,540. Alternatively, a move below 41,275 will signal bearish control, in which case the first support could come at 41,180. However, if the downward momentum continues to prevail, the initial support could be breached, rendering the upside narrative invalid. Furthermore, that could extend the downside to test 41,090.