

- USD/CAD remains under bearish pressure as the pair trades below the 200-day SMA, with repeated consolidation phases breaking to the downside.
- Fundamentally, softer oil prices, US trade policy uncertainty, geopolitical tensions, and upcoming US inflation data continue to shape market sentiment and drive volatility in the pair.
The USD/CAD edges lower amid improved oil prices, which have supported the Canadian dollar. As Canada is the largest crude exporter to the United States. The currency pair is currently trading around 1.3671, declining 0.08% as of today at 11:59 GMT+2.
On the crude oil price front, the West Texas Intermediate (WTI) oil price advances 1.57%, trading around 66.48 after recovering from daily losses. The ongoing nuclear talks between the United States and Iran are significantly influencing the crude oil price’s fluctuations. Additionally, the global geopolitical tensions increase oil prices’ volatility and weigh on US dollar strength, which in turn affects the USD/CAD.
Let’s take a technical outlook on the USD/CAD currency pair, highlighting the key levels to watch.
USD/CAD Technical Outlook | Key Levels to Watch:
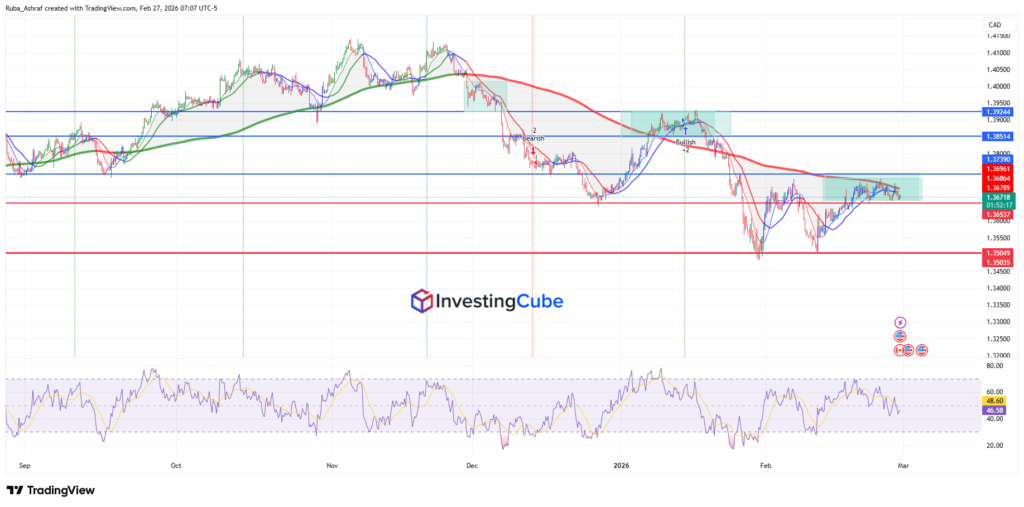
The USD/CAD chart shows a broader bearish structure, with price trading below a descending long-term moving average. It reflects sustained downside pressure. The price repeatedly formed consolidation phases where the price moved sideways inside a well-defined rectangular range.
In several stances, USD/CAD consolidated and traded sideways before eventually breaking below the consolidation zone and printing lower lows, reinforcing the prevailing downtrend structure.
USD/CAD Price Structure and Key Levels:
On the upside, strong resistance is seen at 1.3924, which marks a major previous consolidation ceiling. Below that, 1.38514 acted as intermediate resistance during prior sideways movement. The near-term resistance zone lies between 1.3697 and 1.3686, aligning with the descending moving average and the upper boundary of the current rectangle. This area has repeatedly capped bullish attempts.

On the downside, immediate support is located around 1.3672, followed closely by minor intraday support at 1.3653. The major highlighted support stands at 1.3503, which represents a previous swing low and a key downside target.
If the price decisively breaks below the lower boundary of the current rectangle around the 1.3670-1.3650 zone, the pair could once again print lower lows toward the highlighted major support at 1.3503.
The RSI is currently hovering around the mid-40s to near 50, reflecting neutral momentum. Importantly, RSI is not oversold at present, suggesting there is room for further downside if selling pressure increases.
Notably, as shown on the trading chart, the USD/CAD pair has been trading below the 200-day Simple Moving Average (SMA-200) since November 2025, reflecting significant selling pressure and confirming that sellers remain in control of the broader trend. This contrasts with the period before November 2025, when USD/CAD was trading above the SMA-200, indicating stronger bullish momentum and buyer dominance.
Key Fundamental Factors Shaping Market Sentiment and USD/CAD:
- The latest discussions between the United States and Iran have made diplomatic progress, which has improved the market sentiment. Iran described the latest discussions as the most meaningful so far, outlining clear conditions for sanctions relief.
- However, the geopolitical risks remain elevated as Iran refuses to allow enriched uranium to leave the country. This keeps tensions alive despite ongoing negotiations.
- The strong US military presence in the Middle East and the warning from President Donald Trump about possible military action if talks fail keep risks intact.
- The US Dollar is under pressure, causing USD/CAD to weaken amid uncertainty surrounding US trade policy.
- President Trump is proposing a new tariff plan with a blanket 15% import tariff instead of the previous tariff framework proposal that was rejected by the Supreme Court.
- Tariff risks could increase further, as US Trade Representative Jamieson Greer indicated that tariffs may rise to 15% or higher for several countries soon.
- Markets are awaiting US inflation data, particularly the January Producer Price Index (PPI), which will provide clues about the Federal Reserve’s next policy steps.
- Wholesale inflation is expected to ease, with PPI forecast to slow to 0.3% month-on-month from 0.5% previously, potentially influencing Fed rate expectations.
Canada is a major oil exporter, so higher oil prices typically strengthen the Canadian Dollar, pushing USD/CAD lower, while falling oil prices tend to weaken the CAD.
The 200-day SMA is a key long-term trend indicator. Trading below it signals sustained bearish momentum, while trading above it suggests bullish market control.