

- - The ZAR/INR forecasts for 2026 are derived from the forecasts of USD/INR and USD/ZAR.
- - The macro drivers for the Rand and Rupee will determine how each currency will trade in 2026.
The ZAR/INR forecasts for 2026 centre on market expectations for the progression of the ZAR-to-INR exchange rate for the year. The ZAR is the South African Rand, and the INR is the Indian Rupee. Both countries are members of the BRICS economic bloc, along with Brazil, China, and Russia. These currencies are all considered exotic.
ZAR/INR Live Chart: Where the pair is trading now
The ZAR/INR exchange rate has traded between 5.26 and 5.72 this week, according to quotations from several retail feeds. In the spot forex market, the pair has traded between 5.7244 and 5.6232. These are the upper and lower boundaries of the week’s price range. Very few brokers offer this pair for trading. More commonly, the ZAR to INR rate is derived as a cross rate between USD/ZAR (currently trading at 16.13) and USD/INR (currently trading at 90.65).
ZAR/INR = USDINR ÷ USDZAR
ZAR/INR Forecasts for 2026: Macro Drivers
The two constituent currencies are not just exotic; they are emerging-market currencies. They are highly sensitive to risk and carry trades (predominantly Rand) and investment flows (predominantly Rupee). Here are the macro drivers for the currency pair.
Rand (USD/ZAR)
The Rand displays high sensitivity to:
- Global risk sentiment (risk-on/risk-off market conditions)
- US Dollar movement, especially if it involves US interest rates and bond yields
- Geopolitics, which also leads to changes in risk appetite
- Carry trade, since the SARB’s interest rates are typically higher than those of the G10 currencies. This yields a reasonable interest rate differential, which underpins the carry trade.
Rupee (USD/INR)
The Rupee is primarily driven by:
- Import/export flows, since India is a major global exporter and the 2nd-highest net importer of crude. This places significant pressure on the US Dollar (the global currency of trade). The demand dynamics change from day to day and provide a good basis for pricing USD/INR.
- Central bank policy, including interventions. The interventionist stance of the Reserve Bank of India keeps the USD/INR rate more range-bound than several other emerging-market pairings.
ZAR/INR Forecasts for 2026: Institutional Targets
Most banks do not provide direct forecasts for ZAR/INR. Forecasts are usually derived from the forecast prices of the USD/ZAR and USD/INR for the period under review.

1) MUFG
MUFG typically maintains a forecast table for various FX pairs. Its 2026 FX table indicates the following forecasts for the USD/ZAR, USD/INR, and the implied ZAR/INR forecast targets.
| End-Q1 | End-Q2 | End-Q3 | End-Q4 | |
| USD/ZAR | 16.00 | 15.50 | 15.25 | 15.00 |
| USD/INR | 89.50 | 91.50 | 93.00 | 93.00 |
| ZAR/INR | 5.59 | 5.90 | 6.10 | 6.20 |
In essence, MUFG predicts a ZAR/INR upside for 2026.
2) ING
ING maintains a directional guide within the context of its USD/ZAR forecast and its Asian FX outlook (which features the USD/INR). ING predicts that USD/INR will hit 87.0 by the end of 2026, while its USD/ZAR forecast for 2026 is 16.50 in Q4 2026. This provides an implied value of 5.27 (i.e., 87.0 ÷ 16.5).
ING’s 2026 ZAR/INR forecast is for the pair to trade within the lower part of its year’s range, implying downside for the pair.
3) UBS
UBS does not provide a forecast for ZAR/INR, but it has a target of 15.8 for USD/ZAR. If this is combined with ING’s USD/INR target, it implies an implied ZAR-to-INR exchange rate of 5.51 by end-2026.
Base case: The ZAR/INR trades in a choppy manner within the 5.50-5.85 price range. This scenario sees greater volatility in the Rand in response to global risk sentiment and changing US interest rate expectations.
Bull case: The ZAR/INR trades higher, targeting the 6.10-6.20 price range. This would require depreciation of the Rupee relative to the US Dollar due to heavier-than-projected import demand or increased oil imports. Uneven but broad-based USD weakness against emerging-market currencies, in a manner that lifts the Rand at the expense of other EM FX pairs, is also an angle that could produce this scenario.
Bear case: The bear case scenario sees the pair drift lower, with 5.30-5.50 being the projected target. This scenario is made alive by the RBI’s policy intervention to stabilize the Rupee within a managed float system and by risk-off sentiment that dents the Rand. A lower carry appeal from SARB rate easing at a faster pace than the Fed’s also presents a good bear case for the ZAR/INR.
ZAR/INR Forecasts for 2026: Technical Outlook
The ZAR/INR remains in the long-term uptrend, and the latest bounce off the trendline and the 5.6221 support (61.8% Fibonacci extension of the 24 November – 5 December 2025 upswing) keeps the higher lows intact.
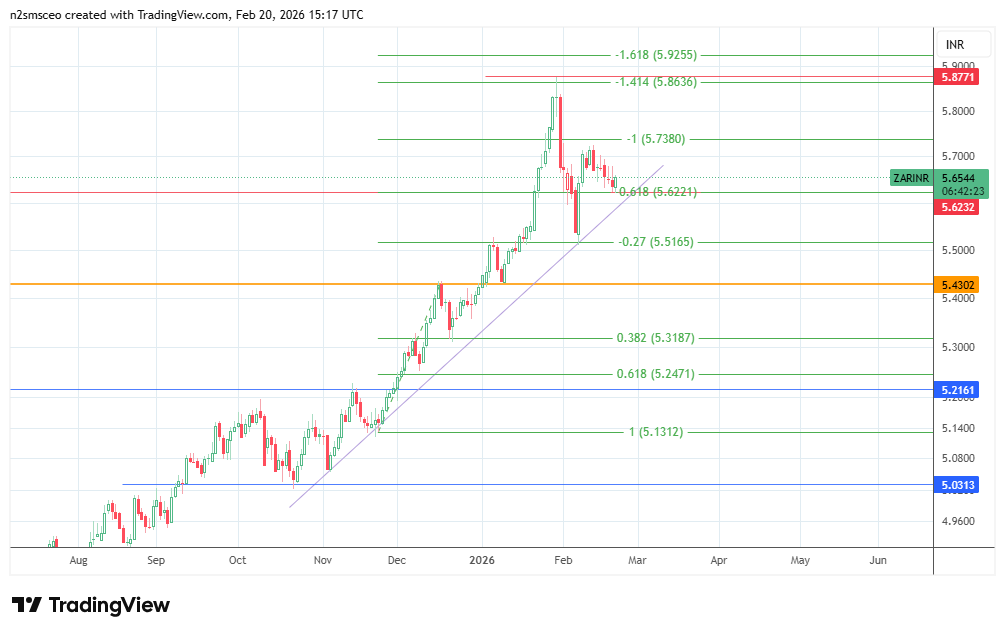
As long as the trendline remains intact, the uptrend remains valid. The bulls would then need to uncap the 5.7380 resistance to clear the pathway towards a retest of the 5.8771 all-time high. 5.9255 is the 161.8% Fibonacci extension and would be a viable new target if the bulls push away this barrier.
However, a breakdown of the trendline and the 5.6221 support provides a basis for a further correction towards 5.5165. If this support fails to hold, a further correction towards 5.4302 cannot be ruled out. Below this mark, a pivot emerges at the 38.2% Fibonacci retracement, where the prior low of 19 December 2025 resides at 5.3187.