
- - The Nvidia share price remains in a post-rally digestion as traders await the next earnings release.
- - The earnings report will determine if there will be a bullish break of 196.30, or a mean-reversion to 170.67.
Where is NVDA Trading Now?
NVIDIA has traded between $172.75 and $196.30 since November 2025. The stock’s range-bound behavior is not surprising. NVIDIA’s share price forecasts and the near-term behavior of market participants will hinge on the next earnings report, due on 25 February 2026. Price action has been volatile this week, and the stock has pushed below the previous week’s high.
NVIDIA remains a core AI infrastructure stock, with near-term guidance continuing to build from Blackwell development, hyperscalar signals for capital expenditure, and forward guidance.
NVIDIA Share Price Pathway for the Week
- 9 February: Nvidia hit a peak of $193.66 intraday, before closing at $190.04.
- 10-12 February: price dropped below $190 as momentum faltered.
- 13 February: A sharply lower close of $182.81 occurred as risk-off sentiment hit markets.
- 17 February – date: price action remains choppy without breaching the previous week’s highs or lows.
NVIDIA Share Price Drivers (Near-term)
The drivers for the Nvidia share price in the near term continue to be the following:
- AI optimism/positioning sentiment
- Earnings
- Mega-cap flows
1. AI optimism/positioning
As a dominant player in the AI field, the stock continues to react to the market’s optimism about AI. Any news or developments around the stock are constantly priced and repriced by traders, producing the volatility that tends to surround these events.
2. Earnings
With the next earnings report due next week, this metric is positioned to be the dominant near-term catalyst.

NVIDIA is expected to report Q4 2025 revenue of $65.6 billion, according to S&P Global forecasts. Q4 adjusted earnings per share are expected to come in at $1.52. Both estimates will represent a YoY increase of 71%. Currently, Nvidia earns no revenue from its China data centre as it navigates US government export restrictions. Its Blackwell and Rubin chips are expected to rake in $350 billion, with the GB 300 chip representing 67% of total Blackwell revenue.
The current consolidation in Nvidia’s share price is a signal that traders are positioning and repositioning their portfolios in anticipation of the earnings report due on 25 February. Earnings will remain a key driver of Nvidia’s share price performance this week.
3. Mega-cap flows
NVIDIA is considered a mega-cap stock, and systematic flows driven by index exposure, hedging, and sentiment (risk-on/risk-off) often move its share price. This is responsible for the two-way volatility in the price action, even when the price is trading within a set range.
NVIDIA Share Price: Key Price Levels
The key price levels in the near term that are considered significant to traders are:
- Resistance: $187.50-$196.30 (this is the recent price ceiling within the range and corresponds to the 9 February high).
- Additional resistance: $212.74 (29 October 2025 post-2024 stock-split all-time high)
- Pivot zone: $180 (this is the close of 17 February and represents the balance point)
- Support: $172.75 (this is the nearest support and lower edge of the range, formed by the 25 November, 17 December, and 5 February 2026 lows).
- Additional support: $154.12 (the prior highs of 21 November 2024 and 7 January 2025, now acting in role reversal).
NVIDIA Share Price Technical Outlook:
NVDA remains in a constructive uptrend, even as it consolidates following the rally, as traders await the earnings report. This is the next catalyst to determine whether NVDA revisits the support at 170.67 or makes another move to attack the 196.30 resistance barrier. Currently, the bulls are still defending the higher lows within the consolidation, but any rallies are being absorbed at 196.30.
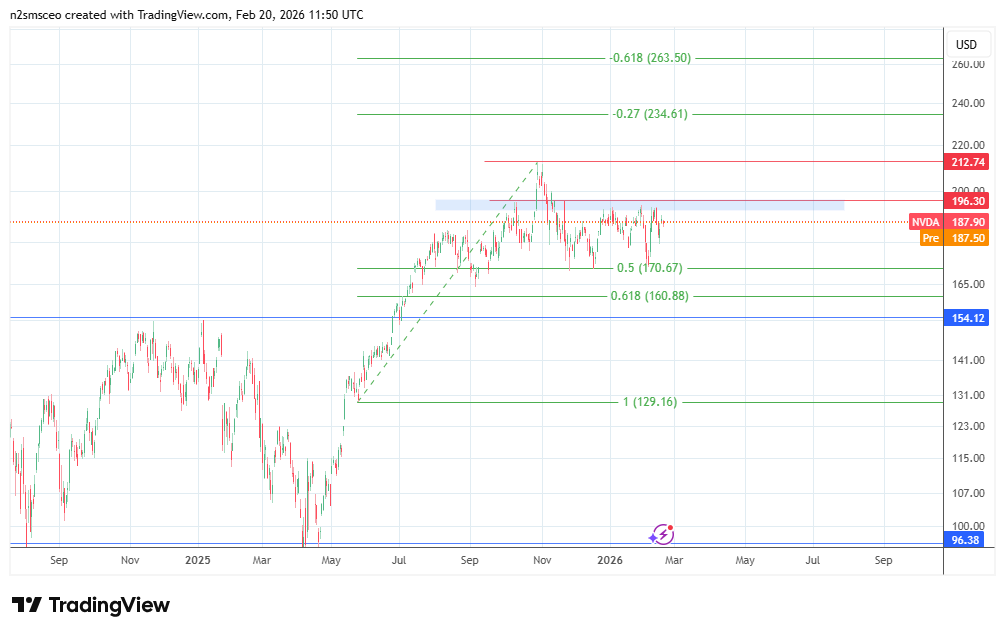
A daily close and acceptance above 196.30 confirms the breakout, with the upside Fibonacci extension levels at 212.74 and 234.61 as targets.
If the price continues to range, mean reversion (selling at resistance and buying at support) is expected at the range boundaries (buying at dips to 170.67 and selling at rallies to 196.30).
Only if the bulls fail to defend 170.67 can we see a decline towards 160.88 initially, amid a potential drop to 154.12, the prior highs of 21 November 2024 and 7 January 2025.