

- Gold price forecasts are for the yellow metal to continue a violent chop within a defined range this week, along with silver prices.
Gold Prices/Silver Prices: What’s happening today?
Precious metals are at the centre of the current “war + oil-shock + interest rates” playbook, so the activity on the gold price and silver price charts is not restricted to safe-haven plays alone. An emerging macro driver is whether the geopolitically motivated spike in oil prices will drive global inflation and prompt central banks to return to tightening mode. In essence, the Fed’s easing expectations that drove metal prices northwards in late 2025 are now at risk of being upended.
Gold price: As of writing on 9 March, the gold price has pulled back slightly from above $5100 and now trades around $5082. This is due to overnight strength in the US Dollar, as safe-haven demand followed the sharp spike in oil prices.
Silver price: A heavy drawdown in the last week of February sent silver prices crashing from record highs. A failed attempt to reclaim those highs resulted in last week’s further decline to 84.47.
Gold/Silver Price Forecasts: Macro Drivers for the Moment
1. Oil Shock and Rise in Inflation Expectations
Oil shock has flipped the safe-haven logic that traditionally worked for metals on its head. Brent crude surged overnight by 25%, hitting as high as $119.50 at the height of the move. Supply concerns are now driving the spike, as the Strait of Hormuz remains closed, trapping more than 3,000 ships. The spike in oil prices has already led to higher prices for derivative fuels and has lifted inflation expectations. This has put pressure on gold prices, as higher inflation expectations suggest central banks (including the Fed) may not cut interest rates anytime soon. Reduced Fed easing expectations are leading US bond yields higher, driving demand for the US Dollar.
2. Reduced Fed easing expectations
Rising bond yields have led to new USD demand, which is now a developing headwind for gold and silver prices. Persistently high oil prices mean central banks will keep policy tighter for longer, which will withdraw demand for non-yielding metals.
Gold/Silver Price Forecasts: What to Watch
Keep a note on the following to keep tabs on the directional sentiment for the week.
- Oil prices pathway: critical for inflation expectations
- USD yields: higher bond yields will drive up the USD, which will push gold/silver prices lower.

Weekly Gold/Silver Price Forecast Scenarios
Base case: the base case scenario favors gold and silver prices remaining range-bound, albeit with violent swings. This is due to the struggle between safe-haven demand on one hand, and pressure from rising USD yields on the other. Silver prices will be more volatile, with a risk of overshoots in either direction, leading to choppy conditions. No clean trend is expected this week.
Bull case: the bull case will play out if oil prices retreat and stabilize, even amid heightened geopolitical risks. This scenario will also play out if the demand for the USD drops and yields cool, restoring classical metal safe-haven demand and driving gold and silver higher.
Bear case: the bear case will play out if oil prices keep rising, stoking further inflation fears. A rise in US bond yields is the natural consequence of a fading of expectations of central bank easing.
In summary, gold and silver prices are not expected to follow the classical safe-haven demand track. Rather, the key macro driver will be USD demand and UST yields, within the context of the geopolitical imbroglio.
Gold/Silver Prices: Technical Outlook
Gold: The 4-hr chart of gold shows choppy price action, with the asset lacking a clear near-term direction. The borders of the range at 5018 and 5218 remain intact, with an intervening resistance at 5097.
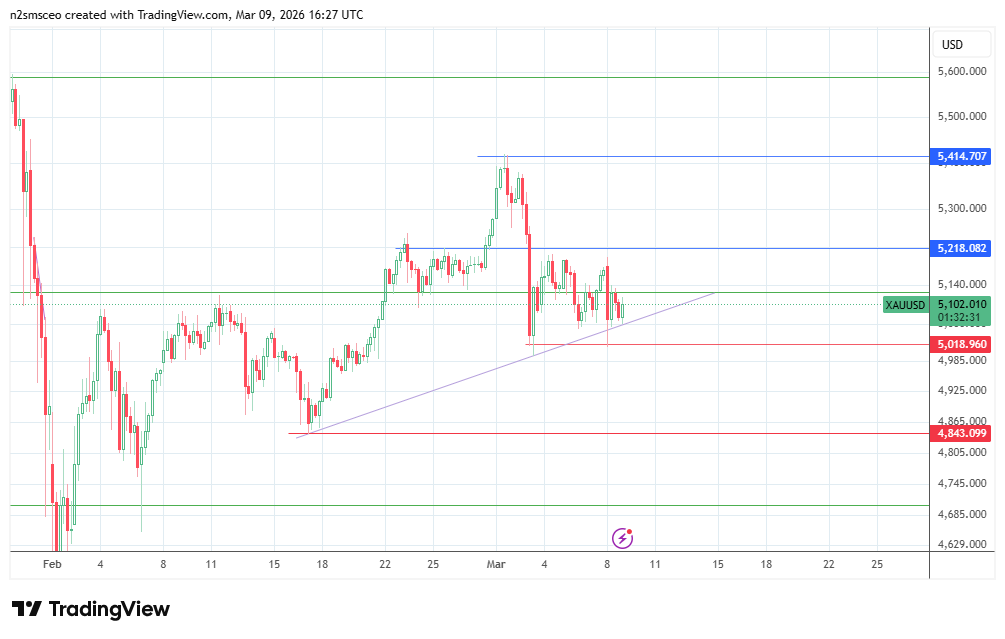
Price needs to degrade these borders to gain directional expression, with the recent swing high at 5414 being a logical upside target if the bulls uncap the 5099 and 5218 resistance levels.
On the flip side, a push lower towards the 17 February low at 4843 is expected if the support at 5018 gives way.
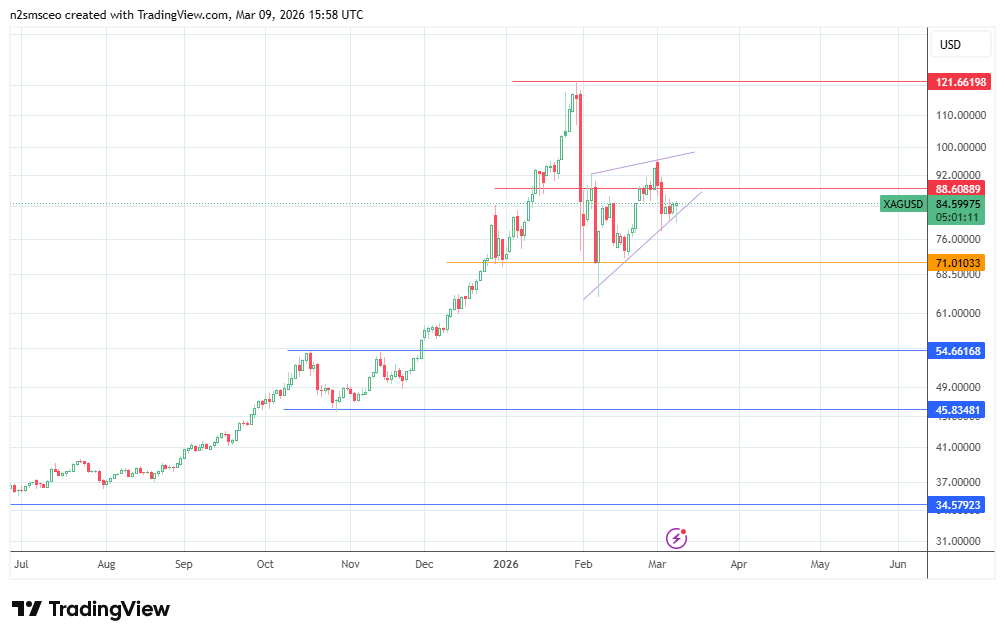
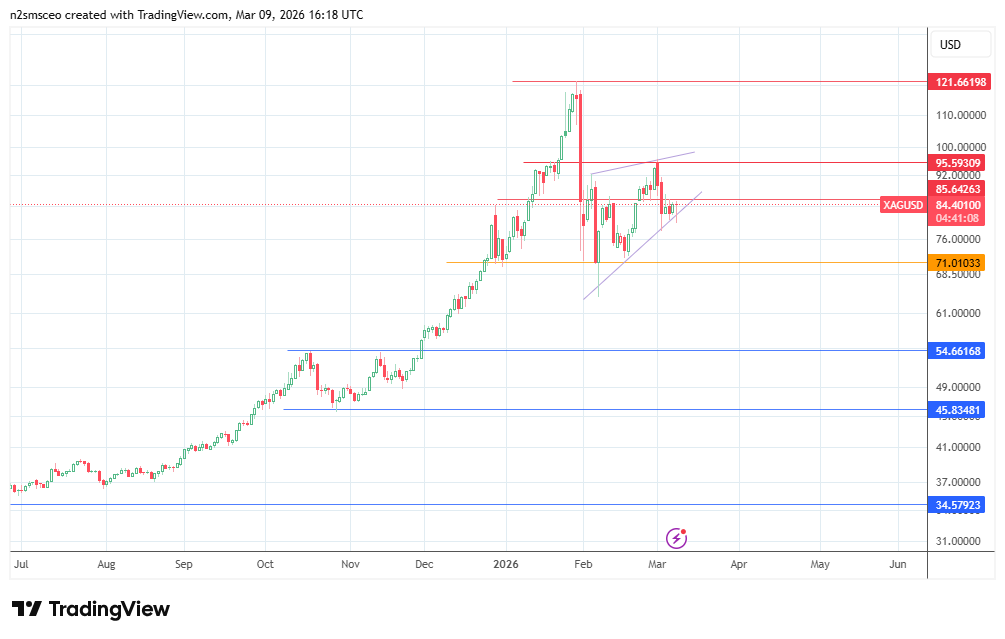
Silver: The daily chart paints a broader picture of an emerging bearish pennant pattern. Currently, the price action is respecting the borders of this emerging pattern.
However, a breakdown of the lower border, brought on by a rejection and subsequent decline from the 85.64 resistance, will see the bears first push towards the 71.01 support (17 February low) and, on a deeper decline, to the expected completion point of the measured move at 54.66. The 6 February low at 64.06 could be an intervening pivot.
Otherwise, a break of the 85.64 resistance and the pattern’s upper boundary at 95.59 (recent swing high of 2 March) will usher in a breakout move that could seek to reclaim the 2026 high at 121.66.