- Ethereum price has formed a bearish pennant pattern which is sign that the downward trend will continue. ETH has performed worse than than BTC and XRP
Ethereum price (ETHUSD) is still struggling. The second-most valuable digital currency in the world is up by 0.48% today but is still down by more than 4.26% in the past 24 hours. That is a steeper decline compared to Bitcoin, Ripple, and Bitcoin Cash whose price has dropped by less than 2%.
Similarly, Ethereum has had a sharper decline in the past week. In the past seven days, its price has dropped by more than 28%, which is worse than the Bitcoin’s drop of 14% and Tether and Ripple’s decline of 0.02% and 19.20%.
As of this writing, Ethereum price is trading at $340, which is substantially lower than the year-to-date high of $490.
There are three primary reasons why this decline has happened. First, ETHUSD has dropped because of profit-taking. Since the price had climbed by more than 400% in the past few months, some bulls felt that it was a good opportunity to exit. This is a normal thing that happens in all assets. Indeed, global stocks have dropped by near 10% in the past week alone.

Second, there have been no new catalyst to push ETH higher. In the past few weeks, the rally was mostly because of ETH 2.0 launch and the fast-growth of Decentralised Finance (DeFi). Now, the correction has happened because these catalysts have already been priced-in.
Third, Ethereum price has dropped because of the stronger dollar. This month, the US dollar has gained by more than 1%, partially reversing the losses that happened in the previous month. Since ETH is mostly traded in dollars, a stronger greenbuck is usually mostly negative for the currency.
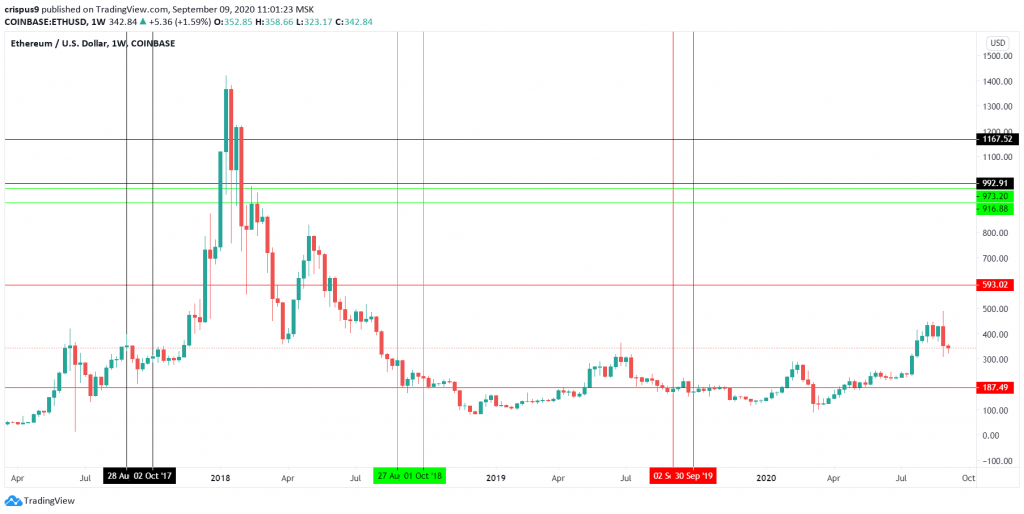
There is another reason. A look at the chart below shows that Ethereum’s price tends to be a bit volatile in September. For example, in September 2017, the price declined from a high of $356 to $240. In the following year, the price fell from $294 to a low of $165. In September last year, the price fell from a high of $218 to a low of $148.
Ethereum price technical outlook
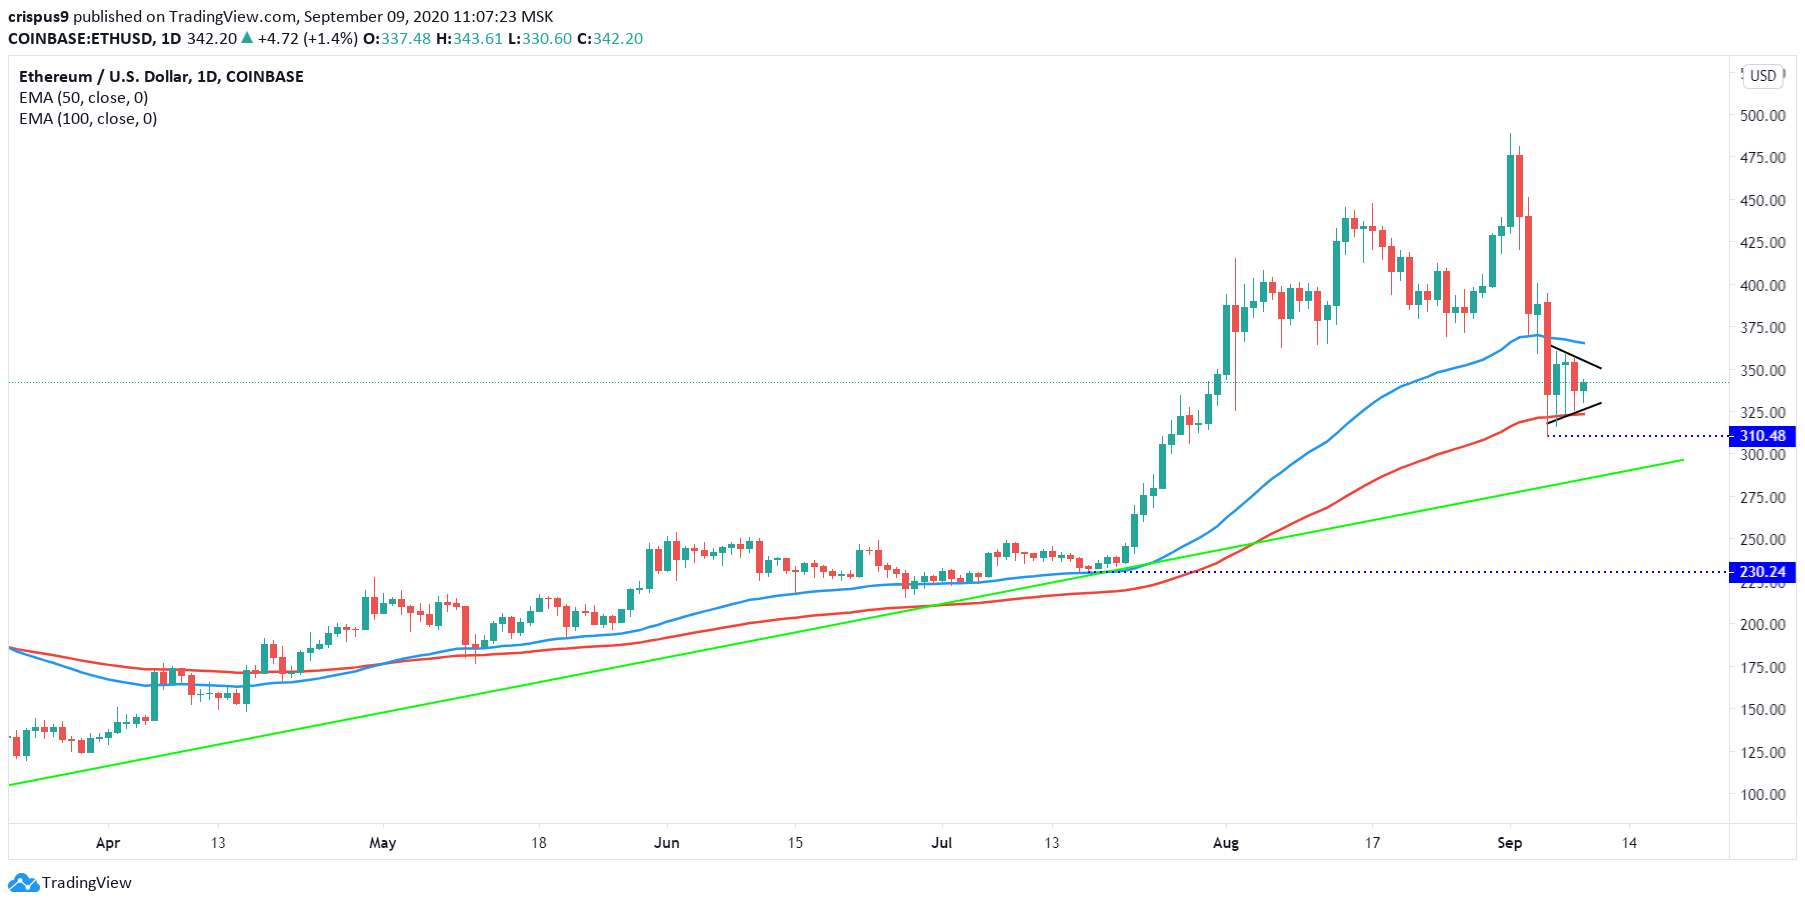
The daily chart below shows that Ethereum price fell to a low of $310 this month. As it dropped, it moved below the 50-day exponential moving average. It is above the ascending trendline that is shown in green. Also, it has formed a bearish pennant pattern.
As you can see in our free forex trading course, a bearish pennant is usually a sign that the price will continue falling. If it does, I suspect that bears will attempt to test the $300 level, which is along the ascending line. On the flip side, a move above the psychological level of $350 will invalidate this trend.
ETHUSD technical chart