Nasdaq
The S&P 500 index has received a positive but cautious directional outlook from economists at Credit Suisse bank. The outlook states that the S&P 500 could hit the 3900 target (which is not too far away), with the potential to target levels between 4070 and 4075 later on.
The positive outlook has come from fundamental and technical standpoints. Technically speaking, the team at Credit Suisse notes the outside week candle as well as the price projection from the symmetrical triangle breakout, which is located at the 3900 price level. The bank expects technical resistance at this point to be overcome, with bulls targeting 3930 initially, and price moving towards 4070/4075 if the resistance target at 3930 gives way.
This outlook could be negated if the pullback towards the 3663 support extends further towards 3605, which is where the bank expects fresh demand.
Fundamentally speaking, analysts are expecting a rally in the S&P 500 in response to the policies of a Biden-led administration.The new government is expected to roll out a $1.9 trillion economic recovery plan, as well as put in place stronger coronavirus prevention strategies; an area where the outgoing government drew a lot of flak on.
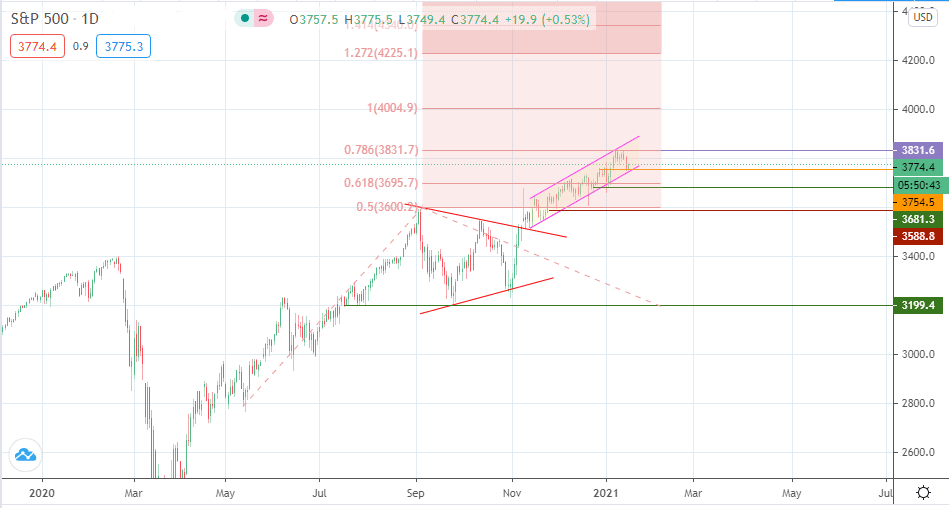
3832.4 remains the price level to beat for bulls on the S&P 500 index chart. A break of this area puts the S&P 500 into new record levels. This would also put the index on the path towards fulfilling the analysis of the research team at Credit Suisse. A run towards 4070 as predicted by Credit Suisse will only be possible if the bulls are able to clear 4004.9.
On the flip side, rejection at the 3832.4 resistance could allow for a pullback to the channel’s trend line, where 3754.5 forms a support. A push below the channel brings in 3681.3 and 3588.8 into the picture.