- Summary:
- Suzlon energy share price has had a stellar performance this year, but it has recently signaled signs of exhaustion on near-term timeframes.
Suzlon Energy share price was in the red in the Monday trading session, extending its losing streak to four daily losses in the last five sessions. The stock was down by -3.3 percent in late afternoon, trading at Rs 76.21. Suzlon Energy (NSE: SUZLON) snapped a four-week winning streak last week, and on Monday went below Rs 76.00 for the first time since August 16.
For an asset that has had a good run in the months and weeks gone by, could this be a sign that the upside momentum has waned? A sharp bullish rally drove SUZLON to a record high Rs 84.29 in mid-August, but it now finds itself with losses of -5.6 percent in the last five days. Nonetheless, its earlier gains mean the current Suzlon Energy share price is still above the 20,50,100 and 200 daily SMAs. However, the price has crossed below the 20-SMA (Rs 79.19) on the 4-hour chart, signaling a potential bearish takeover.
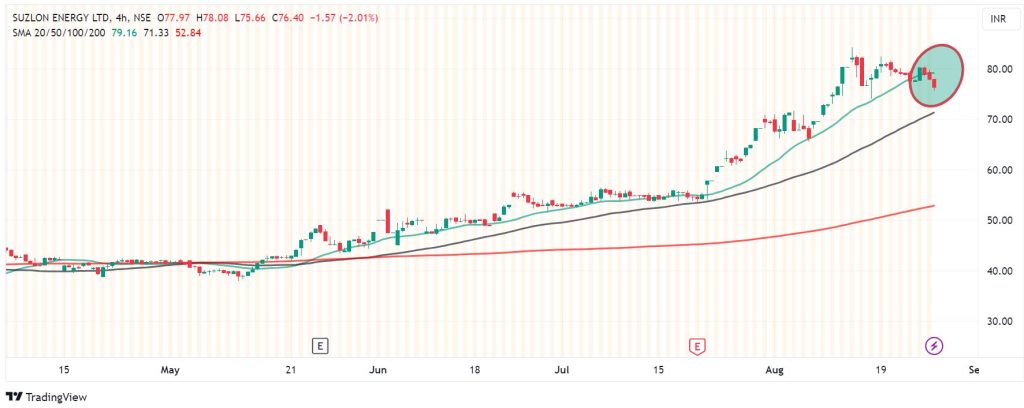
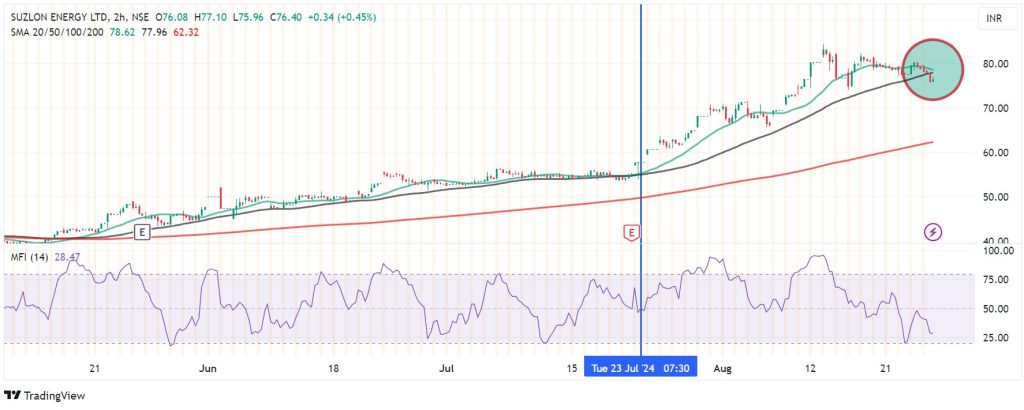
Momentum indicators
As highlighted above, the price has recently broken below the 20-SMA on the 4 hour chart. Meanwhile, the 2-hour chart adds to the downside view, with the price breaching both the 20-SMA and the 50-SMA, last seen in late July. This adds support to the downside view. In addition, the Money Flow Index is at 28, which shows that the value of sales exceeds the value of purchases. Therefore, we are likely to see further decline on the Suzlon share price in the near-term
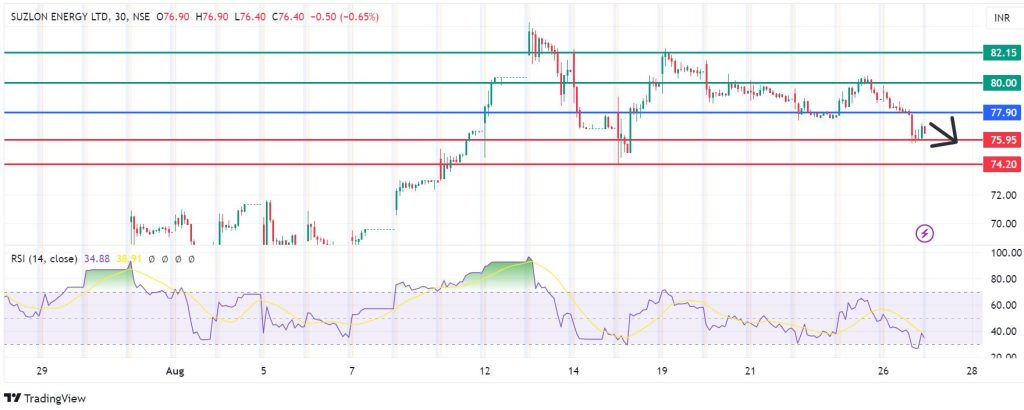
Suzlon support and resistance levels
SUZLON will likely stay on the downward trajectory if resistance persists at the 77.90 pivot mark. That will likely establish the first support at 75.95. However, if they extend their control, the sellers could break below that level and test 74.20.
On the other hand, a move above 77.90 will signal control by the buyers. If that happens, look for the next resistance at 80.00. However, if the sellers extend their control, they could breach that barrier, invalidate the upside narrative and potentially send the share price higher to test 82.15.