- Summary:
- Copper price action continues on its bullish charge, hitting Feb 2013 highs on the back of supply concerns and hopes for more stimulus from a new US govt.
Copper prices picked up from where they ended 2020, with the red metal hitting 2013 highs on fears of supply disruptions and stimulus hopes. Copper prices hit February 2013 highs as Democratic candidates in the Georgia Senate runoff elections edged closer to a victory that would give the party control of both houses of the Congress. This is expected to give US president Joe Biden an easier pathway to pass policies such as additional stimulus packages, avoiding the rancour that followed the latest stimulus.
Furthermore, the threat of a blockade stopping supplies from a major copper mine in Peru is also applying bullish pressure on copper prices. 2020 was marked by severe disruptions in the copper producing mines of the world’s largest suppliers in South America, with several strike actions stifling supplies that were already stretched from recovering Chinese demand.
Technical Levels to Watch
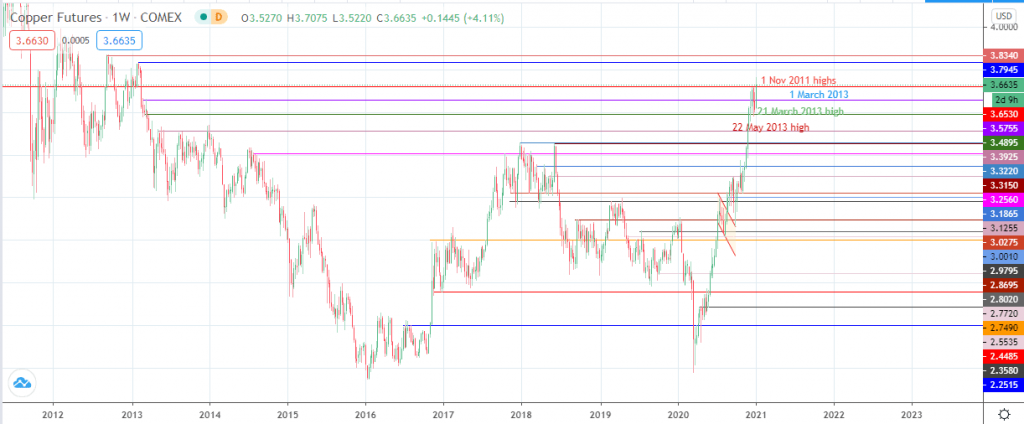
The active copper price candle has breached the 3.6530 resistance (1 Nov 2011 high). Confirmation of a breakout has to come from a double successive closing penetrations above this level, targeting 3.7945 as the initial target (Jan 2013 high). The 3.8340 resistance is the next target to the north, if bullish momentum continues.
On the flip side, failure to confirm the break above 3.6530 opens the door for a pullback towards 3.5755, with 3.4895 and 3.3925 serving as additional downside targets.
Copper Price Chart; Weekly


