Last week’s activity in the commodity market was dominated by a single macro theme: the Iran war and the disruption to oil shipping via the Strait of Hormuz. Some of the biggest moves since the pandemic were seen in the energy market, with a spillover into the metals market. The impact also seeped through to the vegetable oils and grains market, as well as the markets for fertilizers, biofuels, and fossil fuel derivatives.
Reuters has described the oil shipping disruption across the Strait of Hormuz as one of the most severe on record. As a result, the International Energy Agency (IEA) has projected a March hit to global oil supply, prompting it to release 400 million barrels of crude oil from its strategic emergency reserves to ease supply pressure.
Brent Crude and LNG
The energy risk complex was at the heart of the violent price moves seen in Brent crude. The asset began the week on 9 March with a violent spike above $100, peaking at $119.50 before settling at $98.96 on the day. This move was driven by fears of a complete cutoff of Gulf exports due to the blockade at the Strait of Hormuz. 10 March brought a sharp reversal, sending Brent crude to as low as $87.80, after signals emerged of potential talks to de-escalate the conflict. Stockpile releases also helped to cut prices. However, the market turned higher towards the end of the week as the much-awaited de-escalation failed to materialize, with more strikes on both sides and the enforcement of the Strait of Hormuz closure.
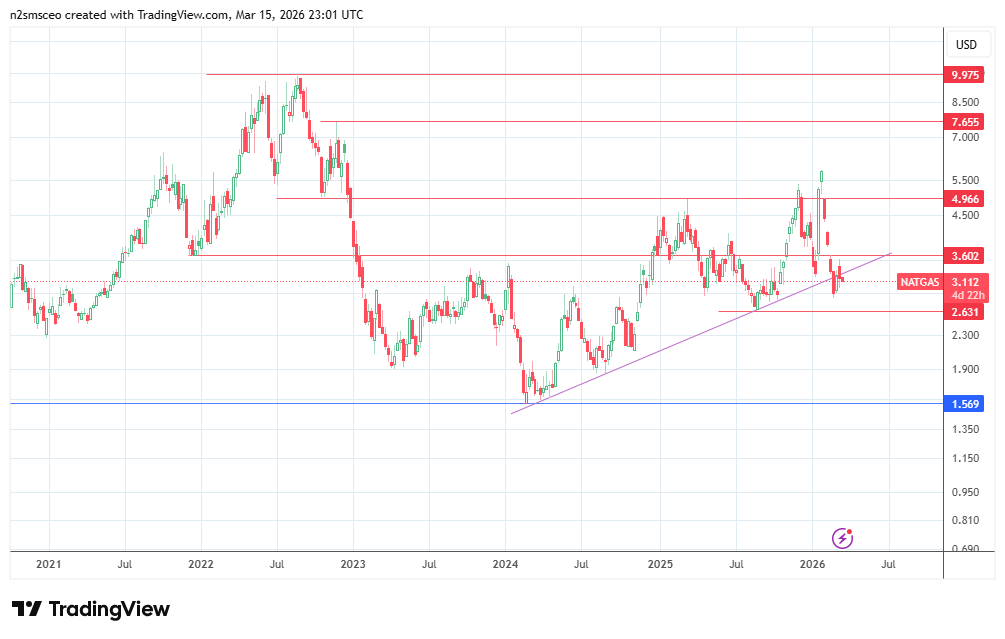
The crude oil derivatives and natural gas were also not spared. However, the LNG market saw 20% of its global supply go offline. However, data from the US Energy Information Administration showed record gas production in 2025, which helped cap US prices relative to global markets. Technically speaking, natural gas prices have formed a double top, and a breach of the trendline could signal lower prices ahead if there is fundamental backing in the form of de-escalation and the reopening of the Strait of Hormuz.

Gold and precious metals
As was discussed in an earlier forecast article for the yellow metal, gold has not had a straightforward safe-haven rally. Rather, it has endured a highly volatile, two-way movement that has pushed it to the limits of a defined range. Gold had rallied 2% earlier in the week under review to $5231 on the back of a softer dollar and retreating oil prices. However, this did not last, and by Friday, gold had tested the lower boundary of the range at 5018.90, down more than 2% that week. This represented a second weekly decline, as higher oil prices stoked fears of globalized inflation and cut any Fed easing expectations.
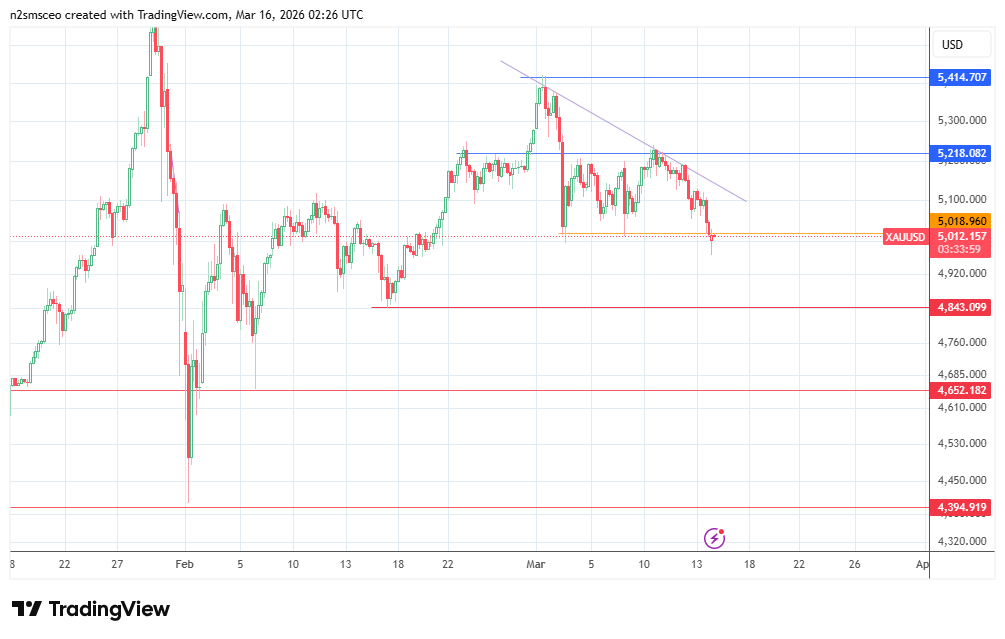
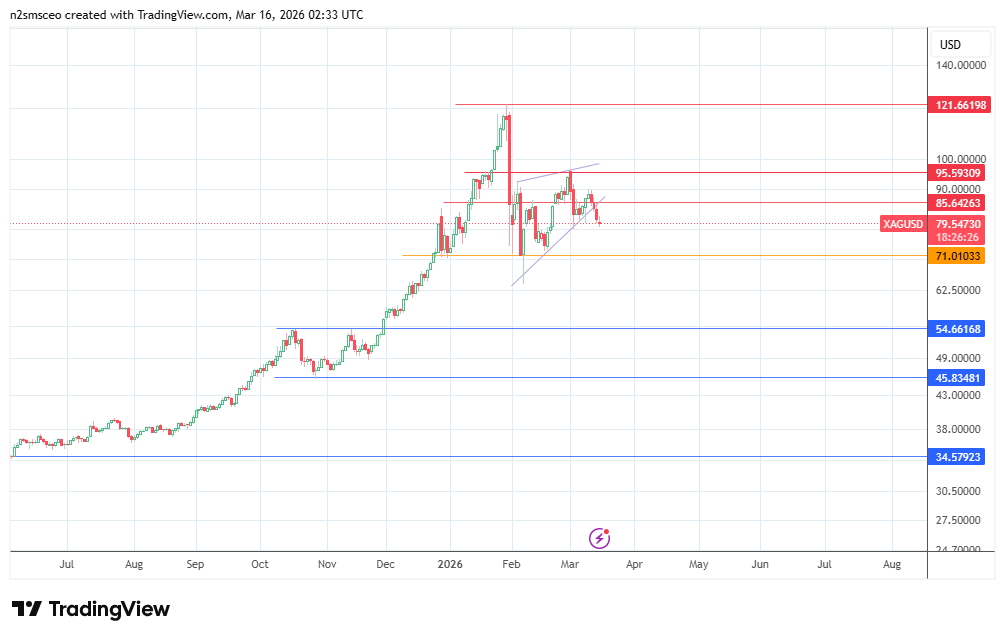
Silver fell even harder, losing 3.3% on Friday alone to close the week at $81 per troy ounce. Platinum and palladium, regarded as industrial metals, also suffered weekly losses. Currently, the price picture for gold looks more bearish than bullish, as the progressively declining tops on the 4-hour chart may signal that demand has begun to wane. A breakdown of the support level currently being tested may signal prices heading below $5000 in the week ahead, barring any bullish surprise triggers.
Silver may also be getting set for a deeper correction, as the rising wedge pattern on the daily chart has effectively been completed with the breakdown of the lower boundary and the 85.64 support level. The immediate target to the south at 71.01 could be the main aim for silver sellers if the bulls are unable to reclaim price levels above the 85.64 mark, which now serves as a role-reversed resistance.