- Summary:
- Apart from a few spikes, Clover health stock continues to trade below its listing price. So Is CLOV just a short squeeze play?
Apart from a few spikes, Clover health stock continues to trade below its listing price. So Is CLOV just a short squeeze play? It’s ironic, but over the last six months, the health insurers chart looks like a cardiograph characterized by prolonged periods of inactivity broken by the price screaming higher before immediately returning to baseline. But since June, the spikes have become less pronounced, and the flatlining is increasing, signalling the worst.
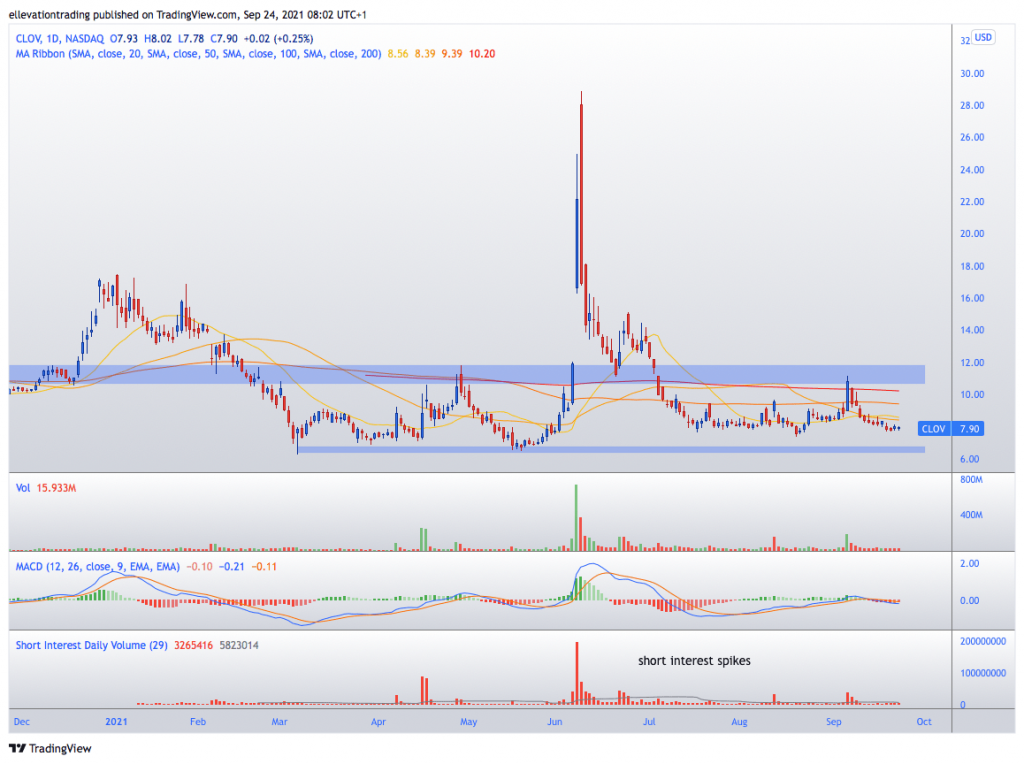
Clover health (NASDAQ: CLOV) promised so much when it joined forces with Chamath Palipathiya’s Social capital last year. The health insurer revealed lofty ambitions to revolutionize the US medicare industry with its software-driven model designed to cut costs for the elderly. And for a while, investors lapped it up. At the end of last year, Clover health stock jumped 60% to a record $17.45. However, by March, CLOV was 60% in the other direction, trading below $7.00. Several large jumps in price have occurred since, all of which have followed a reported increase in short exposure. The largest came in May when Clover embarked on an explosive, three-week, 350% rally to $28.85, only to drop 70% over the next month. Despite transitory signs of life since, Clover is bleeding lower and last changing hands at $7.90, for a 15-month return of -22%.
CLOV Price Analysis
Sadly, the daily chart gives a rather bleak diagnosis of CLOV’s prospect. Although the price is seeing some support between $7.50-$8.00, there is no indication it has found a bottom. The likeliest path is lower in the immediate future, targeting the $6.30 March low. This bearish take stays relevant as long as the price remains below the solid overhead resistance approaching $12.00.
Clearly, this does not make clover stock a worthwhile short, as many burnt short sellers will testify. However, in my opinion, it doesn’t suggest the stock is a buy either.
Clover Health Stock Chart

For more market insights, follow Elliott on Twitter.


