- Summary:
- In this Cardano price prediction, we look at what we should expect going forward now that the price is approaching the $0.4 resistance level.
Cardano price is wavering today after having a strong rally during the weekend. ADA is trading at $0.3765, which is a few points below the weekend high of $0.3974. Other large-cap cryptocurrencies struggled during the weekend, pushing their total market cap to below $1 trillion.
Cardano strong momentum: Cardano price has been on a tear in the past few months. It has gained by more than 140% this year alone, making it one of the best-performing currency in the world.
It has risen by more than 700% in the past 12 months, bringing its total market cap to more than $11.58 billion. This makes it the 6th biggest cryptocurrency in the world after Bitcoin, Ethereum, Tether, Polkadot, and Ripple. It is even bigger than Litecoin, Bitcoin Cash, Bitcoin SV, and Monero. The current rally is possibly because of last week’s Cardano’s hard fork.
Cardano use case: The ADA price rally is mostly because of the overall rally of cryptocurrencies. Also, investors appear to be pleased by the foundation of the network. Its goal is to decentralize the often centralized processes such as the issuance of diplomas, dealing with counterfeit goods, managing supply chains, and handling KYC and AML in the financial industry. It can also be used in healthcare, agriculture, and government. Cardano uses the proof-of-stake process.
Cardano price technical outlook
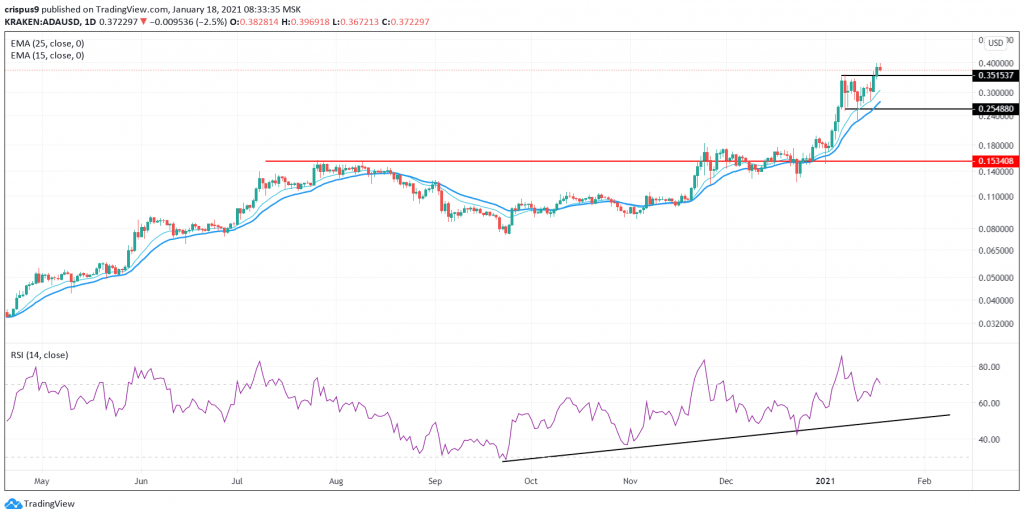
So, what next about Cardano price: The daily chart below shows that the Ada price has been on a strong upward trend recently. In the past few months, it has continued to move above key resistance levels. And on Sunday, it managed to break the key resistance at $0.3515. The price remains above the 25-day and 15-day exponential moving averages.
This rally is also supported by the Relative Strength Index (RSI) that has been rising. Therefore, the price will continue rising as bulls attempt to cross the important resistance at $0.400.
ADA price chart


