Nasdaq
The Nasdaq 100 is trading in a choppy mode this Thursday after a set of mixed fundamentals confronted investors this Thursday. The technology stocks started off the day in positive territory, and are just about holding their own as pressure mounts from weaker fundamentals.
Initial jobless claims failed to impress, with the number of the unemployed applying for benefits for the first-time staying unchanged at 884K. This figure was higher than the 838K that the markets had predicted and it indicates a lack of progress in the UK job market after data released last week showed that private-sector employment and small business hirings continue to suffer.
The Nasdaq’s earlier rise by 0.95% to the intraday high at 11,568.3 has quickly come unstuck as concerns emanating from outside the US spooked the US markets. Fears of a no-deal Brexit have re-emerged after the UK proposed a new law which experts and policymakers are calling a violation of the Brexit Withdrawal Agreement. US House Speaker Nancy Pelosi has waded into the matter, calling on the UK to respect the Northern Ireland Protocol it signed.
The Nasdaq 100 is also facing a stern test as the US Congress decides on new fiscal stimulus. Democrats and Republicans have failed to agree on the scale of the stimulus, more than a month after the previous stimulus package expired on July 29.
The Nasdaq 100 currently trades 0.74% higher at 11457.8 as at the time of writing.
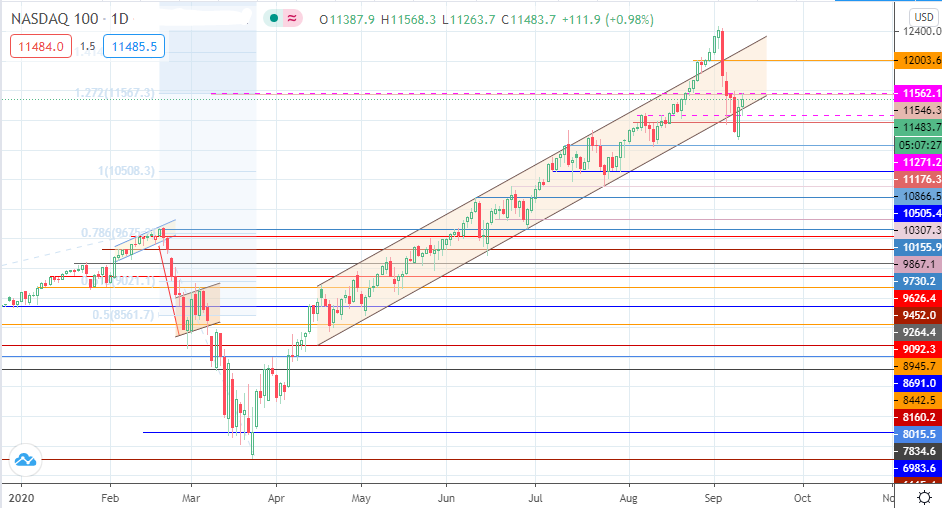
The index is back within the borders of the ascending channel, which has dictated price action for several months. However, today’s price action has found itself limited by the 11562.1 resistance level. A break above this level is required for the index to continue its march towards the opposing channel border. However, 12003.6 is a barrier to this move and may serve as a pitstop to the advance.
On the flip side, rejection at the current resistance may produce some selling, which immediately faces a challenge by the channel’s trendline and the 11271.2 support. A breakdown of these areas is required for price to have a clear path towards 11176.3. 10866.5 and 10505.4 remain support areas that have regained relevance in recent days from the selloff which commenced a week ago.