- Summary:
- The BTT price prediction appears to show a rally selling opportunity, given the intraday rejection of the recovery move on the daily chart.
Coming of the steep slump in the crypto market on Saturday, the intraday upside move on the BTT/USDT chart may not significantly sway the BTT price prediction to the upside.
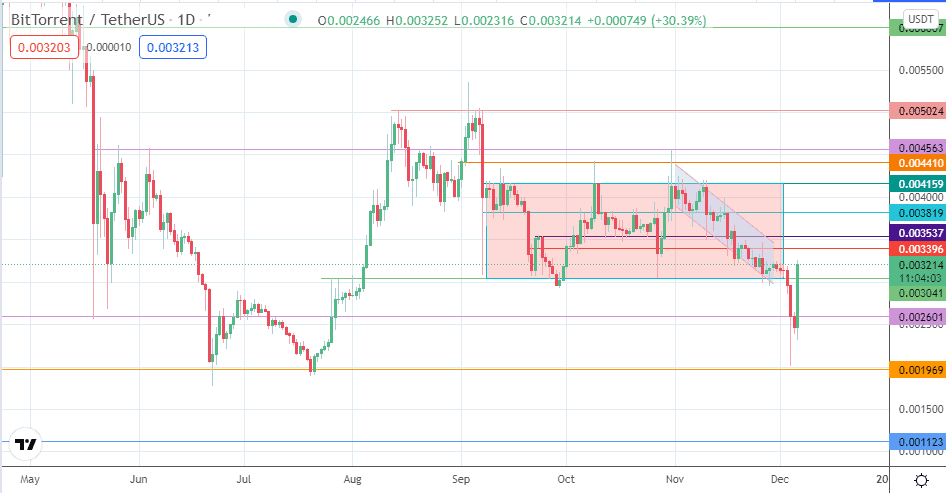
Following Monday’s 27.26% surge, the BTT/USDT pair appears to have fared better than most after the crypto market resumed its downward slide following Sunday’s brief recovery. The BTT/USDT pair had traded much higher on the day, hitting intraday highs at the 0.003537 resistance mark. However, an intraday rejection has occurred, pushing the pair to its current levels at 0.003157 as of writing.
Does this rejection portend greater danger ahead? Here is the BTT price prediction this Monday.
BTT Price Prediction
The active daily candle has violated the resistance at 0.003041. If the bulls achieve a 3% closing penetration above this price barrier, the door opens towards 0.003396. 0.003537 and 0.003819 are additional price targets to the north.
On the flip side, if the sellers see the intraday rally as an opportunity to sell, they may seek to close the daily candle below the 0.003041 resistance. This allows for a potential pullback that targets 0.0002601, with 0.001969 forming an additional support target.
BTT/USDT: Daily Chart

Follow Eno on Twitter.


