Bitcoin – BTCUSD
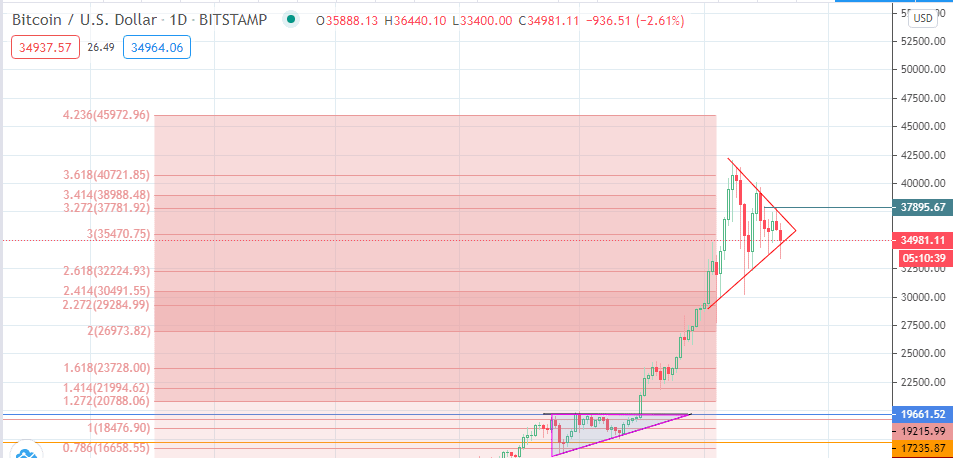
Bullish dumping has been blamed on the fall in Bitcoin prices on the day. Intense selling pressure forced Bitcoin prices to shed off nearly $4000, after yesterday’s rally peaked just short of $37,900.
This move, ending in yet another lower high, continues to maintain the large triangle consolidation area that forms the bullish pennant along with the initial uptrend move that took the BTCUSD from the
2017 highs to the current levels.
The pattern suggests that there could be a bullish continuation, but you never can tell with Bitcoin prices. What does the future hold for Bitcoin prices, now that we are seeing yet another selloff?
The large triangle maintains the borders within which price action continues to function. Today’s candle features a violation of the triangle’s lower border, but buyers forced the candle’s body back into the triangle. A breakdown of this border allows BTCUSD to target the 32224.93 price support (261.8% Fibonacci extension), with additional downside targets at 30491.55 and 29284.99.
On the flip side, a bounce on the lower triangle border could send prices towards 37,895.67 initially, with a breakout taking price to 38988.48 and potentially to 40721.85 or even 45972.96.