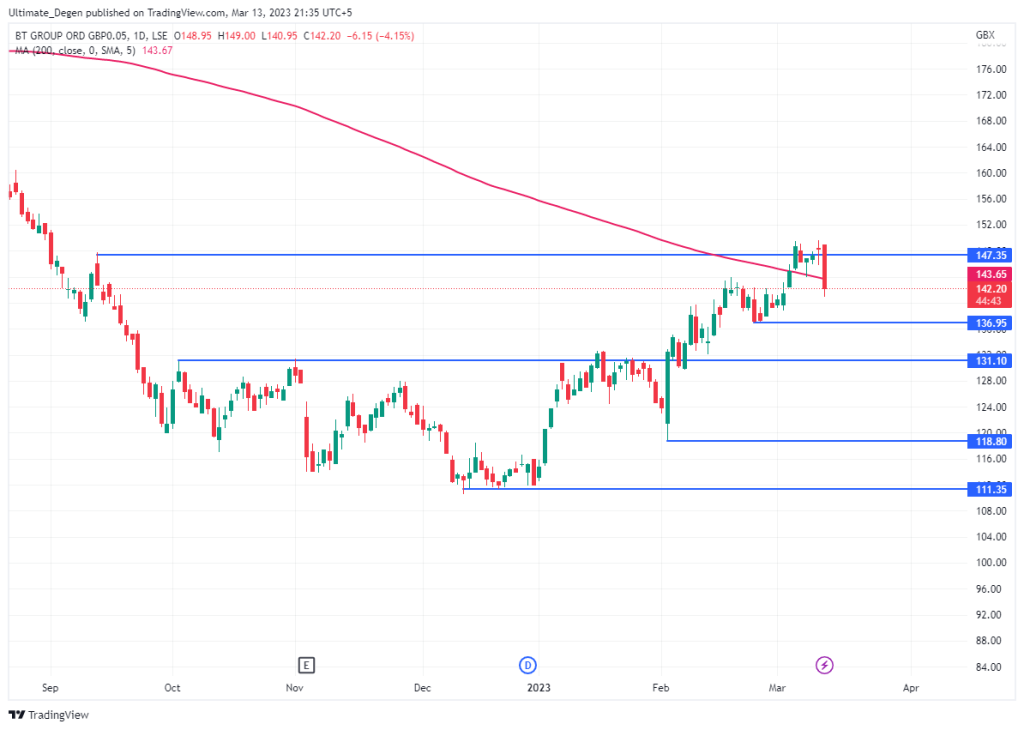
- BT shares experienced a massive sell-off on Monday.
- Till press time, LON: BT.A has lost 4.35% and is trading at 141.95p.
- If the price closes the day below 200-day MA, it can retest 137p in the coming days.
BT share price LON: BT.A is having a very bearish start to the week. After starting the year with a massive uptrend, UK equities are having a major pullback. The benchmark FTSE 100 index dipped to its lowest level for the year, losing 164 points. Banks were the most hit sector today as HSBC, Lloyds, Natwest, and Barclays all showed major losses during the first trading session of the week.
Our analysis shows that BT shares still have a lot of room to grow if the price gains strength above a critical level. However, things may unfold differently if the price drop below another level. Both of these levels are mentioned in this article, considering both bullish and bearish scenarios.
LON: BT.A YTD Rally Stalls Amid Recession Concerns
BT is one of the companies whose shares have performed really well since the start of 2023. just last week, the price surged to 149.6p, which meant YTD gains of 31%. However, LOM: BT.A couldn’t hold this level and had a major pullback today from its opening. The banking contagion of the US has adversely affected the price action of high-risk assets like shares.
On Monday, BT share price opened the day at 149p. The shares kept falling throughout the day as the selling pressure kept increasing. This also marked the biggest loss in a single day by the company shares since 3rd November 2022. Other major UK equities also tanked very hard as investors rushed to protect their capital amid recession concerns.
BT Share Price Forecast & Chart
LSE: BT.A chart shows that the price could be forming a swing failure pattern. This is a bearish reversal pattern which often results in a major pullback. Another major thing of concern is the fact that the price is trading below the 200-day moving average. If the price doesn’t reclaim the 143.67p level in this week then the 200-day moving average will start acting as major resistance.
In such a case, I expect the BT share price to dip to 137p, which might act as support. A failure to bounce from this level can lead to a bigger drop to the 131p level, which has previously acted as a strong resistance. Our forecast will flip very bullish if the price closes a week above the 147.8 level. This may lead to a surge toward the 166p level very quickly.


